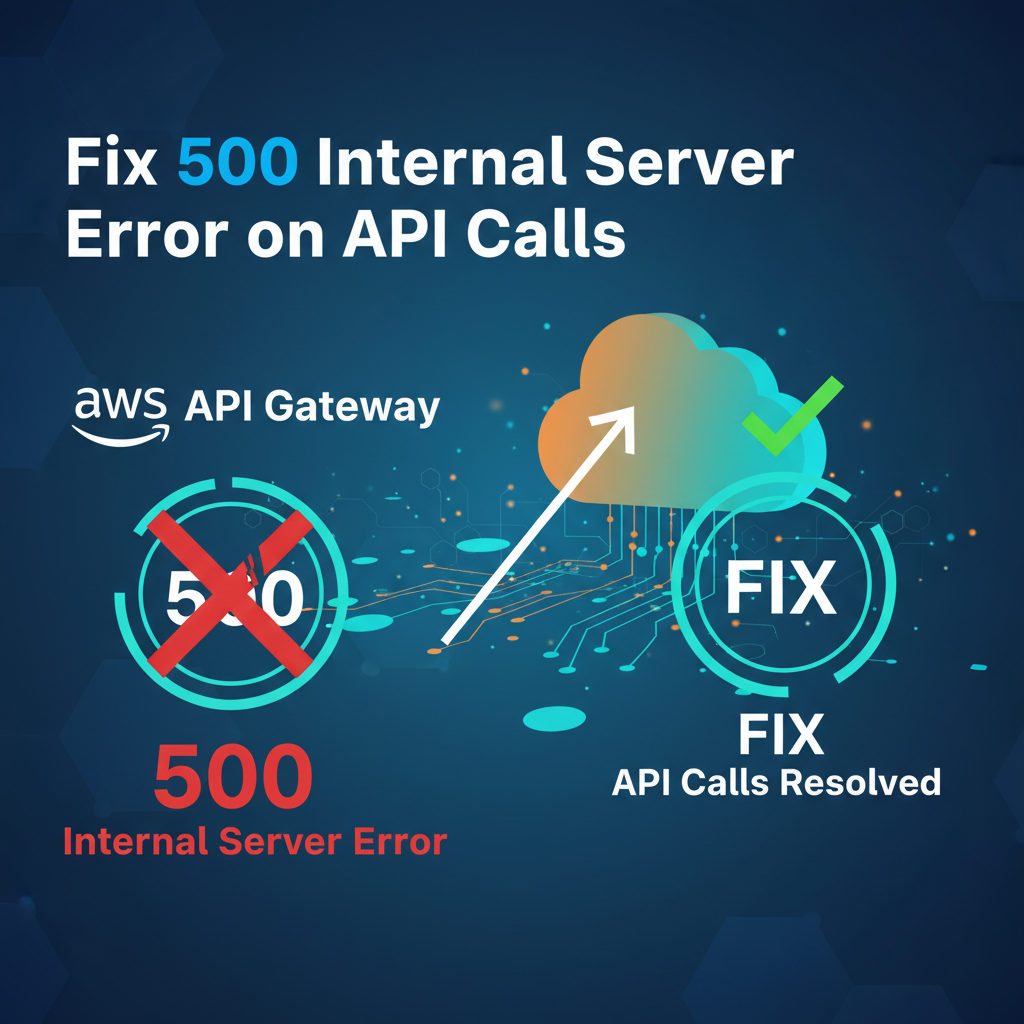
AWS API Gateway: Fix 500 Internal Server Error on API Calls


The relentless march of digital transformation has made APIs the bedrock of modern application development. At the heart of many cloud-native architectures lies AWS API Gateway, a fully managed service that allows developers to create, publish, maintain, monitor, and secure APIs at any scale. It acts as the "front door" for applications to access data, business logic, or functionality from your backend services. From simple data retrieval to complex microservices orchestrations, API Gateway streamlines the process of exposing your services to the world. However, even with such a robust service, encountering errors is an inevitable part of development and operations. Among these, the dreaded "500 Internal Server Error" stands out, often signaling a deeper issue within your API ecosystem.
A "500 Internal Server Error" from your AWS API Gateway is a generic HTTP status code that indicates something went wrong on the server's side, but the server couldn't be more specific about what that was. Unlike a 4xx client error, which points to a problem with the client's request (e.g., malformed request, invalid authentication), a 5xx error shifts the blame to the server or its inability to fulfill a valid request. For an API Gateway, this could mean an issue anywhere in the chain: from API Gateway itself, to its integration with backend services like AWS Lambda functions, EC2 instances, HTTP endpoints, or other AWS services. Diagnosing and resolving these elusive errors requires a systematic approach, deep understanding of API Gateway's architecture, and proficiency in leveraging AWS's powerful diagnostic tools. This comprehensive guide will meticulously explore the common causes of 500 Internal Server Errors originating from AWS API Gateway and provide detailed, actionable strategies to troubleshoot, diagnose, and ultimately fix them, ensuring your APIs remain robust and reliable. We will dissect the problem layer by layer, from initial triage to advanced debugging techniques, equipping you with the knowledge to conquer these challenging issues and maintain seamless API operations.
Understanding the AWS API Gateway Architecture: The Foundation for Troubleshooting
Before diving into troubleshooting, it's crucial to grasp the fundamental architecture and flow of AWS API Gateway. A clear understanding of how requests are processed will illuminate potential points of failure.
At its core, AWS API Gateway functions as a reverse proxy, sitting between your client applications and your backend services. When a client makes an api call, the request traverses several stages within the gateway:
- Request Reception: The client sends an HTTP/HTTPS request to the API Gateway endpoint. This endpoint can be an Edge-optimized endpoint (default, uses CloudFront for lower latency), a Regional endpoint (for clients in the same region), or a Private endpoint (accessible only from within a VPC using VPC Endpoints).
- Method Request: API Gateway evaluates the request against the configured method request settings for the specific path and HTTP method. This includes query parameters, headers, path parameters, and request body validation. If validation fails, a 400-level error is typically returned.
- Authorization: If configured, API Gateway invokes an authorizer (e.g., IAM, Amazon Cognito User Pools, custom Lambda Authorizer) to verify the client's identity and permissions. Authorization failures usually result in 401 (Unauthorized) or 403 (Forbidden) errors, though misconfigurations in Lambda Authorizers can sometimes cascade into 500s.
- Integration Request: This is where API Gateway translates the client's request into a format understood by your backend service. This involves:
- Integration Type: Defining how API Gateway connects to the backend (Lambda function, HTTP, Mock, AWS service, VPC Link).
- Integration Endpoint: Specifying the target of the integration (e.g., Lambda ARN, HTTP URL).
- Mapping Templates (VTL): Crucially, these templates transform the incoming request body, headers, and query parameters into the format expected by the backend. Errors in VTL are a common source of 500s.
- Integration Method: Mapping the API Gateway method to the backend method (e.g.,
POSTtoGET). - Timeout: The maximum duration API Gateway will wait for a backend response (default 29 seconds for most integrations, up to 10 seconds for Lambda proxy).
- Backend Invocation: API Gateway invokes the configured backend service with the transformed request.
- Backend Response: The backend service processes the request and sends a response back to API Gateway.
- Integration Response: API Gateway receives the backend response and translates it back into a format suitable for the client. This also involves:
- Mapping Templates (VTL): Transforming the backend response into the desired client response format.
- Status Code Mapping: Mapping backend status codes to API Gateway response status codes.
- Method Response: API Gateway then sends the final response back to the client, along with appropriate headers and status codes.
Understanding this flow highlights that a 500 error can originate at various points: during integration request processing, actual backend invocation, or integration response processing. The specific integration type significantly impacts the troubleshooting strategy.
The Elusive Nature of the 500 Internal Server Error in API Gateway
A 500 Internal Server Error is inherently frustrating due to its generic nature. It simply states "something went wrong on the server," offering minimal clues about the root cause from the client's perspective. For an api gateway, this ambiguity is amplified because API Gateway itself is a proxy. The error could mean:
- API Gateway Internal Issue: A rare but possible scenario where API Gateway itself encountered an unexpected problem during request processing.
- Backend Service Failure: The most common cause. Your Lambda function crashed, your HTTP endpoint returned an error, or the AWS service you're integrating with failed to respond correctly.
- Integration Configuration Error: API Gateway failed to correctly transform the request for the backend, or it failed to correctly transform the backend's response for the client. This often involves Velocity Template Language (VTL) errors.
- Timeout: The backend service took too long to respond, exceeding the configured api gateway integration timeout (default 29 seconds).
The challenge lies in peeling back these layers of abstraction to pinpoint the precise failure point. This necessitates a systematic approach, heavily reliant on the robust logging and monitoring capabilities provided by AWS.
Phase 1: Initial Triage and Verification – Your First Line of Defense
Before diving deep into logs, a few quick checks can often narrow down the problem or confirm its scope.
1. Check AWS Service Health Dashboard
The very first step for any AWS-related issue should be to consult the AWS Service Health Dashboard. While rare for a fundamental service like API Gateway to have a widespread outage resulting in 500s for a single api, it's a quick check to rule out broader AWS platform issues impacting your region. Look for any reported incidents for API Gateway, Lambda, EC2, or any other AWS service your API relies on.
2. Verify Recent Changes and Deployments
Most issues, especially those manifesting as sudden 500 errors, are often correlated with recent changes. Ask yourself: * Have there been any recent deployments to your api gateway? * Were there any updates to your backend Lambda functions or other services? * Have IAM roles or policies been modified? * Were any network configurations (security groups, NACLs, route tables) altered?
If a recent change coincides with the error, rolling back to a known working version can be a quick fix to restore service while you investigate the specific change. This highlights the importance of controlled deployments and versioning.
3. Basic API Call Verification
Use simple tools to test your api endpoint. * API Gateway Console "Test" Feature: The API Gateway console provides a "Test" tab for each method. This is invaluable as it bypasses client-side issues and gives detailed logs within the console itself for the entire request-response cycle, including integration errors. This often provides enough information to pinpoint the problem immediately. * curl or Postman: Make a direct call to your api endpoint. This verifies connectivity and confirms the 500 error. For curl, use the -v flag for verbose output to see headers.
curl -v -X GET "https://your-api-id.execute-api.your-region.amazonaws.com/your-stage/your-resource"
Or for a POST request with a body:
curl -v -X POST -H "Content-Type: application/json" -d '{"key": "value"}' "https://your-api-id.execute-api.your-region.amazonaws.com/your-stage/your-resource"
If these tests consistently yield 500 errors, it's time to delve into the diagnostic logs.
Phase 2: Deep Dive into API Gateway Logs – The Cornerstone of Debugging
AWS CloudWatch Logs are your single most important tool for diagnosing 500 errors from API Gateway. Without detailed logging, you're flying blind.
1. Enabling CloudWatch Logs for API Gateway
By default, API Gateway doesn't log execution details. You must enable it for each stage of your api.
Steps to Enable: 1. Navigate to your api gateway in the AWS console. 2. Select "Stages" from the left navigation pane. 3. Choose the specific stage (e.g., dev, prod). 4. Go to the "Logs/Tracing" tab. 5. Under "CloudWatch Settings," enable "Enable CloudWatch Logs." 6. Set the "Log Level" to INFO or ERROR. For initial debugging of 500 errors, INFO is often better as it provides more context. 7. Optionally, enable "Log full requests/responses data" if you need to see the entire payload, though be mindful of sensitive data and cost implications. 8. Ensure API Gateway has permission to write to CloudWatch Logs. This is done by selecting or creating an IAM role (often APIGatewayServiceRole) that has logs:CreateLogGroup, logs:CreateLogStream, and logs:PutLogEvents permissions.
Once enabled, API Gateway will create a log group named /aws/api-gateway/{rest-api-id}/{stage-name} in CloudWatch Logs, containing log streams for each request.
2. Understanding API Gateway Log Entries
API Gateway logs are verbose and provide a wealth of information. Key pieces of information to look for when diagnosing 500 errors include:
requestId: A unique identifier for each incoming request. Crucial for tracing a single request through the logs.responseLatency: The total time API Gateway took to process the request.integrationLatency: The time API Gateway waited for the backend to respond. A highintegrationLatencywithout an immediate 500 error might indicate a timeout.status: The HTTP status code returned to the client. We're specifically looking for500.integration.status: The HTTP status code returned by the backend. If this is 200 but API Gateway returns 500, the issue is likely in the integration response mapping. If this is 500, the issue is with the backend.x-amazon-apigateway-api-id: The ID of your API.x-amazon-apigateway-resource-path: The API resource path.x-amazon-apigateway-method: The HTTP method.(AWS Integration)/(Endpoint request URI): These log lines typically appear when API Gateway attempts to invoke the backend. Errors immediately following these often point to backend connectivity or permission issues.Execution failed due to an internal error: A generic message often seen when there's an issue within API Gateway's processing itself, or a critical backend failure that API Gateway couldn't handle gracefully.Lambda.Unhandled: A common indicator when integrating with Lambda, meaning your Lambda function threw an unhandled exception. The actual exception details will be in the Lambda function's own CloudWatch logs.Method completed with status: 500: The final status code API Gateway returned.
3. Using CloudWatch Log Insights for Efficient Analysis
Manually sifting through log streams can be tedious. CloudWatch Log Insights is an indispensable tool for querying and analyzing your logs.
Steps to use Log Insights: 1. Go to CloudWatch in the AWS console. 2. Select "Log Insights" from the left navigation pane. 3. Choose your API Gateway log group (/aws/api-gateway/{rest-api-id}/{stage-name}). 4. Enter queries to filter and extract relevant information.
Example Log Insights Queries: * Find all 500 errors for a specific API: fields @timestamp, @message | filter status = 500 | sort @timestamp desc | limit 100 * Find 500 errors and their integration status, and latency: fields @timestamp, integrationLatency, integration.status, status, @message | filter status = 500 | sort @timestamp desc | limit 100 * Identify specific error patterns (e.g., Lambda unhandled exceptions): fields @timestamp, @message | filter status = 500 and @message like /Lambda.Unhandled/ | sort @timestamp desc | limit 100 Log Insights allows you to quickly aggregate, filter, and visualize log data, making it much easier to spot trends and pinpoint specific error instances.
APIPark is a high-performance AI gateway that allows you to securely access the most comprehensive LLM APIs globally on the APIPark platform, including OpenAI, Anthropic, Mistral, Llama2, Google Gemini, and more.Try APIPark now! 👇👇👇
Phase 3: Common Causes and Specific Troubleshooting Steps
With logging enabled, we can now systematically address the most common culprits behind 500 Internal Server Errors.
Cause 1: Backend Integration Failures (The Most Frequent Culprit)
This is by far the most common reason for API Gateway 500 errors. API Gateway simply passed the request to a backend that couldn't handle it or responded with an error.
a. Lambda Integration Issues
If your api gateway integrates with AWS Lambda, issues within your Lambda function are a prime suspect.
Symptoms in API Gateway Logs: * Lambda.Unhandled in the log message. * Execution failed due to an internal error followed by a Lambda-specific error (e.g., timeout). * integration.status might be empty or indicate a timeout.
Troubleshooting Steps: 1. Check Lambda Function's CloudWatch Logs: * Navigate to your Lambda function in the AWS Console. * Go to the "Monitor" tab and click "View logs in CloudWatch." * Look for ERROR messages, stack traces, and unhandled exceptions. Pay close attention to the requestId if you have it from the API Gateway logs to correlate calls. * Common Lambda errors: * Runtime Errors/Unhandled Exceptions: Your code has a bug (e.g., TypeError, KeyError, IndexError, division by zero). These are usually accompanied by a full stack trace. * Memory Exceeded: The Lambda function ran out of allocated memory. Increase the memory setting. * Timeout: The Lambda function took longer than its configured timeout. Optimize your code, increase the timeout, or consider asynchronous patterns for long-running tasks. * Missing Environment Variables: Your function depends on an environment variable that isn't set. * Incorrect Response Format: If you're using a non-proxy Lambda integration, your function's return object might not match the expected format for API Gateway, leading to an integration response error. For proxy integration, the response must be {"statusCode":..., "headers":{}, "body":""}. 2. Test Lambda Function Directly: Use the "Test" button in the Lambda console. This isolates the Lambda function from API Gateway, confirming if the function itself is the source of the error. 3. Check Lambda IAM Permissions: Does your Lambda function have the necessary permissions (via its execution role) to access other AWS services it needs (e.g., DynamoDB, S3, RDS)? A missing permission can cause an access denied error within Lambda, leading to a 500. 4. Lambda Concurrency Limits: If your Lambda function hits its concurrency limit, invocations will be throttled, potentially causing API Gateway to receive a 500. Check the ConcurrentExecutions metric in CloudWatch for your Lambda function.
b. HTTP/VPC Link Integration Issues
When API Gateway integrates with an external HTTP endpoint, an EC2 instance, or a service via a VPC Link, network or backend server issues are common.
Symptoms in API Gateway Logs: * (Endpoint request URI) indicates the URL API Gateway tried to reach. * Execution failed due to an internal error without specific Lambda.Unhandled messages. * Often, integration.status will be empty or report a non-2xx status code directly from the backend. * Messages like Network error communicating with server or TLS handshake failed.
Troubleshooting Steps: 1. Backend Server Availability: * Is the backend server (EC2 instance, container, etc.) running? * Is the service running on the correct port? * Check backend server logs (e.g., Apache, Nginx, application logs). 2. Network Connectivity: This is a vast area and requires careful examination: * Security Groups/NACLs: Ensure your backend server's security group allows inbound traffic from API Gateway. For VPC Link integrations, the security group associated with the VPC Link's ENIs must allow outbound traffic to your backend and inbound from the backend. * Route Tables: Verify that the subnet containing your backend resource (or the ENIs for VPC Link) has a route to the internet (for public HTTP endpoints) or to the target (for private endpoints). * VPC Link Configuration: If using a VPC Link to connect to an ALB/NLB in your VPC: * Is the VPC Link pointing to the correct NLB/ALB? * Is the target group healthy? * Are the target instances registered and healthy? * Are the security groups for the NLB/ALB allowing traffic from the VPC Link ENIs? * DNS Resolution: Can API Gateway resolve the backend hostname? If using a custom domain in your backend, ensure it's resolvable within your VPC or publicly, as appropriate. 3. SSL/TLS Handshake Errors: If your backend uses HTTPS, ensure: * The SSL certificate on the backend is valid, not expired, and correctly configured. * The CA chain is trusted. * API Gateway supports the backend's TLS version. 4. Backend Timeout: Your backend service might be taking longer than the API Gateway's 29-second integration timeout. Optimize your backend, increase server resources, or consider implementing an asynchronous pattern. 5. Proxy Configuration: If API Gateway integrates with a proxy (e.g., Nginx on EC2) that then calls your actual service, check the proxy's logs and configuration.
c. AWS Service Integration Issues
When API Gateway integrates directly with another AWS service (e.g., DynamoDB, S3, SQS), the issue often boils down to permissions or incorrect request parameters.
Symptoms in API Gateway Logs: * Execution failed due to an internal error accompanied by specific AWS service errors (e.g., Access Denied, ResourceNotFoundException). * Messages indicating malformed service requests.
Troubleshooting Steps: 1. IAM Role Permissions: The IAM role assumed by API Gateway (configured in the integration request) must have the necessary permissions to call the target AWS service with the specified actions. For example, dynamodb:PutItem, s3:GetObject. Use the IAM Policy Simulator to verify. 2. Request Parameters: Ensure the parameters you're passing to the AWS service through the integration request mapping template are correct and conform to the service's API specifications. A malformed request can result in a 500.
Cause 2: API Gateway Configuration Issues
Sometimes, the problem lies within API Gateway's own configuration, especially related to how it processes and transforms requests or responses.
a. Request/Response Mapping Templates (VTL) Errors
Velocity Template Language (VTL) mapping templates are powerful but prone to syntax errors or logical flaws, which can manifest as 500 errors.
Symptoms in API Gateway Logs: * Execution failed due to an internal error with messages related to template processing (e.g., invalid escape sequence, unrecognized token, evaluation of reference '$input.body' failed). * The integration.status might be 200 (if the backend responded successfully) but the status returned to the client is 500 (meaning the error occurred during integration response mapping).
Troubleshooting Steps: 1. Test in API Gateway Console: Use the "Test" feature in the console for your method. The response will include detailed logs indicating exactly where the VTL failed. 2. Syntax Check: Carefully review your VTL for syntax errors, unclosed parentheses, incorrect variable references ($input.body, $context, $util), or escape sequence issues. 3. Data Type Mismatches: Ensure your VTL is transforming data into the correct types expected by the backend or client. For example, if your backend expects a number but your VTL passes a string. 4. Null or Missing Values: If your VTL tries to access a field that might be null or missing in the input (e.g., $input.path('$.some.nested.field')), it can cause an error. Use $util.defaultIfNull or check for existence before accessing. 5. Encoding Issues: If you're dealing with binary data or specific content types, ensure your VTL is handling encoding/decoding correctly.
b. Integration Request/Response Settings
Minor misconfigurations in integration settings can lead to unexpected 500s.
Symptoms in API Gateway Logs: * Execution failed due to an internal error. * May not have explicit VTL errors but rather indicate a failure to match content types or methods.
Troubleshooting Steps: 1. HTTP Method Mismatch: Ensure the HTTP method configured for the API Gateway integration matches the method expected by the backend service. 2. Content-Type Headers: Verify that the Content-Type header being sent to the backend (via integration request) or expected from the backend (via integration response) is correctly configured. Mismatches can prevent proper mapping. 3. Path/Query Parameter Mappings: If you're using path or query parameters, ensure they are correctly mapped from the method request to the integration request. 4. Lambda Proxy vs. Non-Proxy Integration: Understand the difference. Proxy integration simplifies configuration but requires the Lambda function to return a specific JSON structure. Non-proxy gives more control via VTL but requires more setup. Ensure your Lambda function's response matches the configured integration type.
c. Timeout Settings
API Gateway has an integration timeout (maximum 29 seconds for most integrations). If your backend takes longer than this, API Gateway will terminate the connection and return a 500 error. For Lambda proxy integrations, the maximum timeout for the Lambda function itself is 10 seconds, which is also the maximum API Gateway will wait.
Symptoms in API Gateway Logs: * integrationLatency close to 29000 ms (or 10000 ms for Lambda proxy). * Endpoint response timed out.
Troubleshooting Steps: 1. Optimize Backend Performance: The primary solution is to make your backend service faster. Profile your Lambda function or optimize database queries. 2. Increase Lambda Timeout: If using Lambda, increase the function's timeout (up to 15 minutes), but remember API Gateway's integration timeout still applies. For the 29-second limit, if your Lambda needs more than 10 seconds, you must use a non-proxy integration. 3. Asynchronous Processing: For long-running tasks, consider an asynchronous pattern. The API Gateway api could immediately return a 202 (Accepted) response while the backend processes the request asynchronously (e.g., by putting a message on SQS and having a Lambda process it). The client can then poll a status api or receive a notification.
Cause 3: Authorization and Authentication Failures (Sometimes Masquerading as 500)
While authorizer failures typically result in 401 (Unauthorized) or 403 (Forbidden), misconfigurations or internal errors within a custom Lambda Authorizer can sometimes cascade into a 500.
Symptoms in API Gateway Logs: * Authorizer configuration invalid or Authorizer failed with error. * Execution failed due to an internal error specifically related to authorizer invocation.
Troubleshooting Steps: 1. Lambda Authorizer Logs: If you're using a Lambda Authorizer, check its dedicated CloudWatch logs for runtime errors, timeouts, or incorrect response formats. The Authorizer must return a specific IAM policy JSON structure. 2. IAM Role Permissions: Ensure the IAM role used by the Lambda Authorizer (if it calls other AWS services) has the necessary permissions. 3. Caching: If authorizer results are cached, ensure your cache keys are configured correctly and consider temporarily disabling caching during debugging. 4. Timeout: If the Lambda Authorizer takes too long to respond, it can cause a 500.
Cause 4: Throttling and Service Limits
While throttling usually results in 429 (Too Many Requests), extreme or misconfigured throttling can sometimes lead to backend saturation and subsequent 500 errors.
Symptoms in API Gateway Logs/CloudWatch Metrics: * 5XXError metrics spike in CloudWatch for your api gateway. * Backend service logs show high load, resource exhaustion, or specific throttling errors. * Throttling messages in API Gateway execution logs.
Troubleshooting Steps: 11. Monitor CloudWatch Metrics: Keep an eye on the following API Gateway metrics: * Count: Total api requests. * 5XXError: Number of server-side errors. * Latency: Total time from client to API Gateway to backend and back. * IntegrationLatency: Time spent waiting for the backend. * Also monitor Lambda concurrency, CPU utilization, database connections, etc., for your backend services. 12. Increase Throttling Limits: If legitimate traffic is hitting limits, you might need to adjust API Gateway's stage-level or method-level throttling limits. However, ensure your backend can handle the increased load. 13. Implement Rate Limiting and Quotas: Use API Gateway's built-in features to define usage plans, set rate limits, and enforce quotas to protect your backend from overload.
For organizations managing a large number of APIs, particularly those integrating with AI models, a robust API management platform becomes critical. Products like APIPark offer comprehensive API lifecycle management, including traffic forwarding, load balancing, and detailed API call logging. These features are invaluable for identifying performance bottlenecks, managing high-scale traffic, and performing preventative maintenance. With APIPark's ability to integrate 100+ AI models and encapsulate prompts into REST API endpoints, it helps standardize API formats and manage access, reducing the complexity often associated with modern, diverse API ecosystems. Its performance, rivaling Nginx, ensures that your gateway itself isn't the bottleneck, providing the resilience needed to avoid 500 errors stemming from traffic surges or inefficient management.
Cause 5: Deployment Issues
Flawed deployments can introduce configuration errors that lead to 500s.
Symptoms in API Gateway Logs: * New errors appearing immediately after a deployment. * Configuration details not matching expectations.
Troubleshooting Steps: 1. Review Recent Deployments: Check what changed in the latest deployment. 2. Rollback: If possible, roll back to the previous working deployment. 3. Stage Variables: Ensure stage variables are correctly configured and not overriding critical settings unintentionally. 4. Resource Policies: Verify that any resource policies attached to your API Gateway are correctly configured after deployment, especially if moving between accounts or VPCs.
Phase 4: Advanced Debugging and Best Practices
For persistent or complex 500 errors, more advanced tools and practices are essential.
1. AWS X-Ray for End-to-End Tracing
AWS X-Ray provides end-to-end tracing of requests as they travel through your application, including API Gateway, Lambda, and other integrated AWS services. It's incredibly powerful for visualizing the entire request flow and identifying latency bottlenecks or failure points.
How to Use X-Ray: 1. Enable X-Ray for API Gateway: In your API Gateway stage settings (Logs/Tracing tab), enable "Enable X-Ray Tracing." 2. Enable X-Ray for Lambda: In your Lambda function's configuration, enable "Active Tracing." 3. Instrument Backend Services: For other services (e.g., EC2 applications), you might need to install and configure the X-Ray SDK. 4. Analyze Traces: In the X-Ray console, you'll see a service map and detailed timelines for each request. Look for segments that show errors (red) or high latency (yellow). This visual representation can quickly pinpoint exactly where the 500 error originated.
2. Canary Deployments
For critical APIs, canary deployments allow you to gradually shift traffic to a new version of your api gateway or backend. If 500 errors spike, you can quickly roll back, minimizing impact on your users. API Gateway supports canary releases directly within its stage settings.
3. Circuit Breaker Pattern
Implement a circuit breaker pattern in your client or application logic. If your backend service starts returning a high rate of 500 errors, the circuit breaker can prevent your clients from continuously hammering a failing service, giving it time to recover.
4. Retry Mechanisms
For transient 500 errors (e.g., temporary network glitches, brief backend unavailability), implement client-side retry mechanisms with exponential backoff. This can improve the resilience of your client applications.
5. Robust Monitoring and Alarming
Don't wait for users to report 500 errors. Set up CloudWatch Alarms on key metrics: * API Gateway 5XXError: Alarm when the percentage or count of 5XX errors exceeds a threshold. * Lambda Errors: Alarm when the Errors metric for your backend Lambda functions spikes. * Lambda Throttles: Alarm if your Lambda functions are being throttled. * Backend Application Metrics: For EC2 or containerized backends, monitor CPU utilization, memory usage, and application-specific error logs.
These alarms can notify you (via SNS, email, chat ops) immediately when issues arise, allowing for proactive resolution.
6. API Gateway Metrics in CloudWatch
Beyond basic error counts, delve into other API Gateway metrics in CloudWatch: * CacheHitCount / CacheMissCount: If using caching, check these to ensure caching is working as expected. * DataProcessed: Track the amount of data processed by your API. * IntegrationLatency: High values indicate a slow backend. * Latency: Overall API response time.
Analyzing these metrics over time can reveal performance regressions or underlying issues that might eventually lead to 500 errors.
Phase 5: Preventative Measures and Design Considerations
Beyond reactive troubleshooting, proactive design and development practices can significantly reduce the occurrence of 500 Internal Server Errors.
1. Robust Error Handling in Backend Services
Your backend services (Lambda functions, EC2 applications) must implement comprehensive error handling. * Catch Exceptions: Use try-catch blocks to gracefully handle expected and unexpected errors. * Log Details: When an error occurs, log sufficient detail (stack trace, input, relevant variables) to facilitate debugging, but be mindful of sensitive information. * Return Meaningful Errors: Instead of just crashing, your backend should return specific 4xx or 5xx HTTP status codes along with a descriptive error message to API Gateway. This allows API Gateway to map these to appropriate client responses. For example, a missing item in a database should return a 404 from the backend, not cause an unhandled exception that API Gateway converts to a 500.
2. Idempotency for API Operations
Design your APIs to be idempotent where appropriate. This means that making the same API call multiple times has the same effect as making it once. This is crucial for retries, as a client can safely retry a request without unintended side effects if the first attempt resulted in a transient 500.
3. Asynchronous Processing for Long-Running Tasks
As discussed, API Gateway has a 29-second timeout. If your api involves tasks that take longer, shift them to an asynchronous model. * Client -> API Gateway -> SQS/SNS -> Lambda Worker: The API Gateway immediately returns a 202 (Accepted) response after queuing the request, and a separate worker processes the task. * Webhook/Notifications: The client can be notified via a webhook or push notification once the long-running task completes.
4. Thorough Testing (Unit, Integration, Load)
Comprehensive testing before deployment is non-negotiable. * Unit Tests: For individual backend components (Lambda functions, business logic). * Integration Tests: Verify the full flow from client through API Gateway to the backend. * Load Testing: Simulate high traffic volumes to identify performance bottlenecks and potential scaling issues that could lead to 500 errors under stress.
5. Infrastructure as Code (IaC)
Using IaC tools like AWS CloudFormation, AWS CDK, or Terraform ensures that your API Gateway configuration and backend resources are consistently deployed across environments. This reduces human error and configuration drift, which can introduce subtle bugs.
6. Regular Security Audits
Misconfigured security settings, such as overly permissive IAM roles or incorrect resource policies, can lead to unauthorized access or unexpected failures that may manifest as 500 errors. Regular audits help ensure compliance and prevent vulnerabilities.
7. Versioning Your APIs
Implement API versioning (e.g., /v1/myresource, /v2/myresource). This allows you to introduce breaking changes without impacting existing clients and provides a clear rollback path if a new version introduces errors.
Conclusion
The 500 Internal Server Error, while generic, is a critical signal that something is amiss in your API ecosystem. When it originates from AWS API Gateway, it often points to a problem within its integration with backend services, be it a malfunctioning Lambda function, an unreachable HTTP endpoint, or a misconfigured AWS service call. Diagnosing these errors demands a systematic and methodical approach, leveraging the powerful diagnostic tools AWS provides.
Our journey through this troubleshooting guide has underscored several key principles: * Logs are Paramount: AWS CloudWatch Logs, particularly when coupled with Log Insights, are your single most valuable resource for dissecting the request-response cycle and pinpointing error origins. * Understand the Architecture: A deep comprehension of how AWS API Gateway processes requests, from client reception to backend integration and response mapping, is crucial for effective debugging. * Systematic Elimination: Start with initial checks, then move to specific integration types, and finally, consider API Gateway's internal configuration. * Leverage Advanced Tools: For complex scenarios, AWS X-Ray offers invaluable end-to-end tracing, visualizing bottlenecks and failure points across distributed services. * Proactive Prevention: Beyond fixing errors, focus on robust error handling in your backend, comprehensive testing, asynchronous patterns for long-running tasks, and vigilant monitoring to build resilient APIs that minimize future occurrences of 500 errors.
By embracing these strategies, you transform the intimidating 500 Internal Server Error from an opaque roadblock into a valuable diagnostic clue. Mastering the art of troubleshooting AWS API Gateway ensures that your api endpoints remain reliable, performant, and capable of seamlessly powering your applications, ultimately contributing to a robust and stable digital infrastructure.
Frequently Asked Questions (FAQs)
1. What does a "500 Internal Server Error" from AWS API Gateway specifically mean?
A 500 Internal Server Error from AWS API Gateway means that the API Gateway or its integrated backend service encountered an unexpected condition that prevented it from fulfilling a valid client request. It's a generic server-side error, not a client-side error (like 4xx). This could stem from issues within the backend service (e.g., Lambda function crash, unavailable HTTP endpoint), incorrect API Gateway integration configuration (e.g., VTL mapping errors), timeouts, or less commonly, an internal issue with API Gateway itself.
2. How do I enable logging for AWS API Gateway to diagnose 500 errors?
To enable logging, navigate to your API Gateway in the AWS Console, select "Stages," then choose the specific stage you want to monitor (e.g., dev, prod). Go to the "Logs/Tracing" tab, enable "CloudWatch Logs," set the "Log Level" to INFO (for detailed debugging), and ensure API Gateway has an IAM role with permissions to write to CloudWatch Logs. This will create a log group (/aws/api-gateway/{rest-api-id}/{stage-name}) where you can find detailed request/response information.
3. My API Gateway is returning 500 errors, but my Lambda function (backend) logs show success. What could be the issue?
If your Lambda function successfully executes, but API Gateway still returns a 500, the problem most likely lies in the integration response mapping within API Gateway. This means API Gateway successfully received a response from Lambda but failed to transform it into the client-facing response due to a misconfiguration. Check your API Gateway's "Integration Response" settings for the method, specifically the "Mapping Templates." Look for VTL (Velocity Template Language) syntax errors or logical flaws that cause the transformation to fail, or ensure the Lambda's response format matches what API Gateway expects for the chosen integration type (e.g., proxy vs. non-proxy).
4. What are the common causes of 500 errors specifically when using Lambda integration with API Gateway?
Common causes for 500 errors with Lambda integration include: 1. Lambda Runtime Errors: Unhandled exceptions or bugs within your Lambda function's code (check Lambda's CloudWatch logs for stack traces). 2. Lambda Timeouts: The Lambda function taking longer than its configured timeout (check Lambda's CloudWatch logs for Task timed out messages). 3. Lambda Memory Exceeded: The Lambda function running out of allocated memory. 4. Lambda IAM Permissions: The Lambda function's execution role lacking necessary permissions to access other AWS services it depends on. 5. Incorrect Lambda Response Format: The Lambda function returning a response body that doesn't conform to the format API Gateway expects, especially for proxy integrations ({"statusCode":..., "headers":{}, "body":""}).
5. How can AWS X-Ray help in troubleshooting API Gateway 500 errors?
AWS X-Ray provides end-to-end tracing of requests across distributed services, making it invaluable for diagnosing 500 errors. By enabling X-Ray for both your API Gateway stage and your backend Lambda functions (or instrumenting other backend services), you can visualize the entire request flow as a service map and detailed timeline. X-Ray will highlight which segment of the request (e.g., API Gateway processing, Lambda invocation, database call within Lambda) caused an error or introduced significant latency, allowing you to quickly pinpoint the exact source of the 500 error and any bottlenecks.
🚀You can securely and efficiently call the OpenAI API on APIPark in just two steps:
Step 1: Deploy the APIPark AI gateway in 5 minutes.
APIPark is developed based on Golang, offering strong product performance and low development and maintenance costs. You can deploy APIPark with a single command line.
curl -sSO https://download.apipark.com/install/quick-start.sh; bash quick-start.sh

In my experience, you can see the successful deployment interface within 5 to 10 minutes. Then, you can log in to APIPark using your account.

Step 2: Call the OpenAI API.