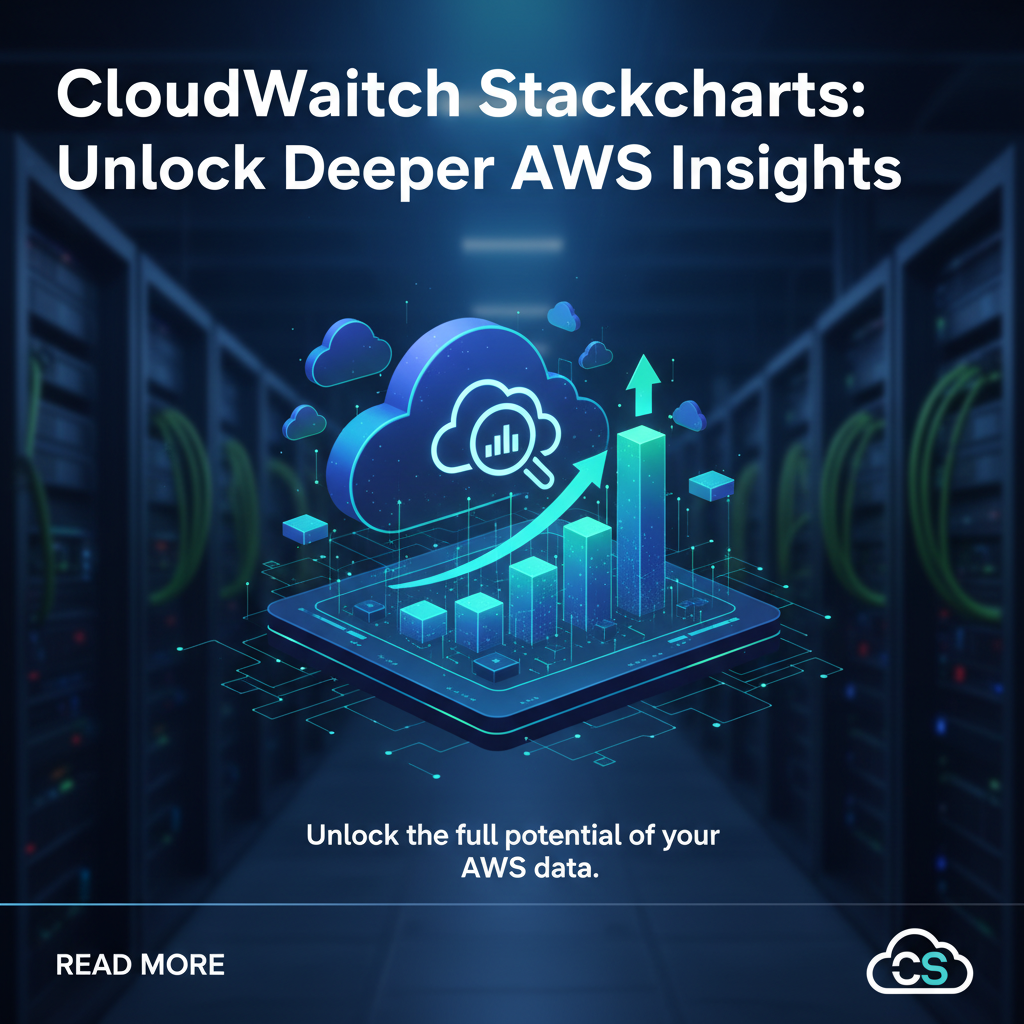
CloudWatch Stackcharts: Unlock Deeper AWS Insights


The Imperative for Deeper AWS Insights
In the sprawling and dynamic universe of Amazon Web Services (AWS), the ability to peer into the operational heart of your infrastructure and applications is not merely a convenience; it is an absolute necessity. Modern cloud architectures, characterized by microservices, serverless functions, containers, and a plethora of managed services, present an intricate web of interdependencies that can overwhelm even the most seasoned engineers. As organizations scale their presence on AWS, the sheer volume of data generated by these services – metrics, logs, and events – can become a daunting deluge rather than a valuable data stream. Without a robust and insightful monitoring strategy, navigating this complexity to ensure performance, optimize costs, and maintain reliability is akin to piloting a spacecraft blindfolded through an asteroid field. The stakes are incredibly high, with every millisecond of latency, every resource bottleneck, and every unhandled error potentially impacting user experience, business revenue, and brand reputation.
The foundational layer for this critical observability journey within AWS is undoubtedly Amazon CloudWatch. CloudWatch serves as the centralized monitoring and observability service, providing data and actionable insights to monitor applications, respond to system-wide performance changes, optimize resource utilization, and get a unified view of operational health. It collects monitoring and operational data in the form of logs, metrics, and events, offering a comprehensive suite of tools to visualize, analyze, and act upon this information. However, as architectures grow in complexity and the number of individual resources multiplies, traditional dashboarding techniques, often relying on simple line graphs and bar charts, begin to show their limitations. While effective for monitoring individual resource health or aggregate trends, they frequently fall short in illustrating the nuanced interplay between numerous homogenous resources or in providing a truly holistic, contextualized view of an entire service or application stack.
This is precisely where the innovative power of CloudWatch Stackcharts emerges as a game-changer, promising to revolutionize how organizations achieve deeper AWS insights. Stackcharts move beyond the one-dimensional visualization of single metrics, offering a sophisticated, multi-layered approach to representing data. They allow engineers and architects to visualize the contribution of individual components within a group to a cumulative total, or to observe the distribution of a metric across a fleet of resources, all within a single, coherent graph. This capability is not just about presenting more data; it's about presenting data with profound context, enabling a quicker understanding of patterns, anomalies, and performance distributions that would otherwise require painstaking manual correlation across dozens of individual graphs. The promise of Stackcharts is to transform raw data into actionable intelligence, empowering teams to move from reactive firefighting to proactive optimization and strategic capacity planning. By leveraging Stackcharts, organizations can truly unlock an unprecedented level of cloud observability, gaining a comprehensive and nuanced understanding of their AWS environment, identifying subtle performance degradation, pinpointing cost inefficiencies, and ultimately building more resilient and performant cloud-native applications. This article delves deep into the mechanisms, applications, and profound benefits of CloudWatch Stackcharts, illustrating how they serve as an indispensable tool for mastering AWS monitoring and achieving unparalleled operational clarity.
Understanding AWS CloudWatch: The Bedrock of Monitoring
To fully appreciate the transformative capabilities of CloudWatch Stackcharts, it is essential to first solidify our understanding of AWS CloudWatch itself, which forms the fundamental bedrock upon which all advanced monitoring strategies are built. CloudWatch is not merely a collection of isolated tools; it is a holistic observability platform that brings together three core data types: metrics, logs, and events. These components work in concert to provide a panoramic view of the health, performance, and operational status of AWS resources and applications running on AWS.
Metrics are numerical time-series data points that represent a specific measurement over a period. Every AWS service automatically publishes a wealth of metrics to CloudWatch, from EC2 instance CPU utilization and network I/O, to Lambda invocation counts and duration, to S3 request counts and latency. Users can also publish custom metrics from their applications or on-premises resources, expanding the monitoring scope beyond native AWS services. These metrics are fundamental for tracking resource performance and identifying trends. They are stored with a timestamp, a unit (e.g., percent, bytes, count), and dimensions (key-value pairs that uniquely identify a metric, such as InstanceId for EC2 CPU utilization). The power of metrics lies in their quantifiability and their ability to show performance over time, forming the basis for alarms and scaling actions.
Logs are records of activity generated by applications, services, and AWS resources. CloudWatch Logs enables users to centralize logs from various sources, including EC2 instances, Lambda functions, AWS CloudTrail, and custom application logs. Once collected, logs can be searched, filtered, and analyzed using CloudWatch Logs Insights, a powerful query engine that allows for complex ad-hoc queries, pattern discovery, and even the extraction of specific data points that can be converted into custom metrics. The ability to correlate log data with metric data is crucial for root cause analysis, as logs often contain the detailed context necessary to understand why a metric might be deviating from its baseline. For example, a sudden spike in Lambda errors (a metric) could be investigated by querying the corresponding Lambda execution logs for error messages.
Events in CloudWatch Events (now integrated with Amazon EventBridge) provide a near real-time stream of system events that describe changes in AWS resources. These events can be generated by AWS services (e.g., an EC2 instance state change, an Auto Scaling group launching an instance, a new object being uploaded to S3) or by custom applications. EventBridge allows users to define rules that match specific event patterns and route them to targets like Lambda functions, SNS topics, SQS queues, or even other AWS services, enabling automated responses to operational changes. This event-driven architecture is critical for automating tasks, reacting to security incidents, and building resilient, self-healing systems.
The evolution of CloudWatch capabilities has been continuous, reflecting the growing sophistication of cloud deployments. Initially, CloudWatch primarily offered basic metric collection and simple alarms. Over time, it has expanded to include advanced features such as: - CloudWatch Dashboards: Customizable homepages to monitor resources in a single view, combining metrics, logs, and alarms. - CloudWatch Alarms: Automated notifications or actions triggered when a metric crosses a predefined threshold. - CloudWatch Logs Insights: A powerful, interactive query service for analyzing log data. - Metric Math: The ability to perform calculations on multiple metrics to create new time-series data for display on dashboards or for use in alarms. - Anomaly Detection: Machine learning-powered capabilities to automatically identify unusual patterns in metric data, reducing the need for manually setting static thresholds. - CloudWatch Contributor Insights: Helps identify top talkers and significant contributors to metric performance, useful for pinpointing specific problematic resources. - CloudWatch ServiceLens: Provides an end-to-end view of your applications by integrating traces from AWS X-Ray, metrics, and logs into a single view.
Despite these advancements, traditional dashboarding, often composed of numerous independent line graphs or bar charts, frequently falls short when confronted with the immense scale and dynamic nature of modern cloud environments. Imagine monitoring a microservices architecture deployed across hundreds of Lambda functions, dozens of EC2 instances in an Auto Scaling group, and multiple containers running on ECS or EKS. A dashboard filled with individual graphs for each resource's CPU, memory, network, and application-specific metrics quickly becomes overwhelming and impractical. It becomes exceedingly difficult to discern aggregate patterns, identify outliers across a fleet, or understand the collective behavior of a group of resources that together form a logical component of an application. The mental overhead required to correlate data points across dozens of disparate graphs to form a coherent understanding is immense and error-prone. This is precisely the gap that Stackcharts are designed to bridge, offering a more intuitive and powerful way to visualize collective resource behavior and distribution. CloudWatch, in essence, acts as a vast data lake for operational intelligence, and Stackcharts are the specialized lenses that allow us to extract deeper, more meaningful insights from this ocean of data.
Deconstructing Stackcharts: What Are They and Why Do They Matter?
CloudWatch Stackcharts represent a significant leap forward in AWS monitoring and data visualization, moving beyond the conventional line and area graphs to offer a richer, more contextualized view of your cloud resources. At their core, Stackcharts are a type of area graph where multiple data series are "stacked" on top of each other, allowing for the visualization of both individual contributions and their cumulative total over time. Unlike a standard line graph where each series occupies its own space, or a simple area chart showing a single aggregate, Stackcharts provide a powerful way to observe the distribution and behavior of a metric across numerous related resources within a single, cohesive visual representation.
The fundamental concept behind a Stackchart is its ability to illustrate relationships and proportions. For instance, if you are monitoring the CPU utilization of an Auto Scaling group comprising many EC2 instances, a traditional line graph might show only the average or sum of CPU utilization across the group. While useful for overall trends, it would mask the individual contributions of each instance. A Stackchart, however, would display each instance's CPU utilization as a distinct layer in the stack, allowing you to simultaneously observe:
- The total aggregate CPU utilization of the entire Auto Scaling group (the top boundary of the stack).
- The individual CPU utilization of each EC2 instance (the height of each colored layer).
- The proportion that each instance contributes to the total.
- How the distribution of load across instances changes over time.
This simultaneous visibility into both the whole and its parts is what makes Stackcharts so incredibly powerful for deeper AWS insights. They allow you to easily identify "hot" instances carrying disproportionate loads, "cold" instances that might be underutilized, or instances that have suddenly started behaving differently from their peers.
Stackcharts fundamentally differ from standard line graphs and traditional area charts in their ability to contextualize individual data points within a group. A line graph is excellent for tracking a single metric or a few distinct, non-overlapping metrics over time. An area chart typically fills the space below a single line, often representing a cumulative total. Stackcharts, conversely, are designed for scenarios where you have many individual series that logically belong together and contribute to a common pool. By stacking these series, they reveal the composition of that pool and how it evolves. This is particularly valuable when dealing with collections of resources that are intended to function as a unit, such as:
- EC2 Instances in an Auto Scaling Group: Visualizing CPU, memory, or network I/O per instance to understand load distribution.
- Lambda Functions: Tracking the duration or invocation count of different versions or different functions within a microservice.
- ECS/EKS Tasks/Pods: Monitoring CPU, memory, or network usage per container or task to identify resource hogs.
- RDS Read Replicas: Observing read/write IOPS per replica to ensure even distribution and prevent single points of contention.
The power of "stacking" extends to any scenario where you need to group metrics by specific dimensions. For example, you could stack InvocationCount for a group of Lambda functions, grouped by their FunctionName dimension. Or you could stack NetworkOut bytes for a fleet of EC2 instances, grouped by InstanceId. This grouping mechanism is crucial because it allows you to dynamically visualize the behavior of dynamic resources. As instances are added or removed from an Auto Scaling group, the Stackchart automatically adjusts, reflecting the current composition of the fleet.
Consider a microservices architecture built on AWS Lambda. You might have several Lambda functions contributing to a single user request. A Stackchart showing the Duration of each of these functions, stacked together, would provide an immediate visual understanding of where processing time is being spent across the entire request flow. If one particular function's duration layer suddenly widens, you know exactly where to investigate. This contrasts sharply with sifting through individual graphs for each Lambda function, a process that is not only time-consuming but also prone to misinterpretation due to the lack of a unified, cumulative context.
Furthermore, Stackcharts are instrumental in identifying resource contention and dependencies. If a Stackchart for database connections shows that one particular application's connection layer is consistently consuming a disproportionately large segment of the total, it immediately flags a potential issue. This application might be causing a bottleneck for other services sharing the database, or it might indicate an inefficient connection pooling strategy within that application. Without the stacked visualization, identifying such a contributor could be a much more involved and time-consuming diagnostic process, often requiring specialized queries and manual aggregation.
In essence, Stackcharts elevate cloud observability by transforming raw metric data into a dynamic, compositional narrative. They answer not just "what is the total?" but also "who is contributing how much to the total?" and "how is that contribution changing over time?" This deeper level of insight is invaluable for performance tuning, cost optimization, and rapid troubleshooting in the complex landscapes of modern AWS deployments.
APIPark is a high-performance AI gateway that allows you to securely access the most comprehensive LLM APIs globally on the APIPark platform, including OpenAI, Anthropic, Mistral, Llama2, Google Gemini, and more.Try APIPark now! 👇👇👇
Implementing CloudWatch Stackcharts: A Practical Guide
Implementing CloudWatch Stackcharts effectively requires a solid understanding of CloudWatch dashboarding principles, metric collection, and the specific configurations that unlock their advanced visualization capabilities. This section will walk through the practical steps and best practices for creating and leveraging Stackcharts to gain deeper AWS insights.
Setting Up CloudWatch Dashboards
Before diving into Stackcharts, ensure you have a CloudWatch Dashboard set up. Dashboards are customizable homepages in the CloudWatch console that allow you to monitor your resources in a single view. 1. Navigate to the CloudWatch console. 2. In the left-hand navigation pane, select "Dashboards" and then "Create dashboard." 3. Give your dashboard a meaningful name (e.g., MyApplication-Performance, EC2-Fleet-Health).
Creating Custom Metrics and Logs for Stackcharts
While AWS services automatically publish a wealth of metrics, you may often need custom metrics from your applications to gain the most relevant insights. * Custom Metrics: Use the PutMetricData API call (via AWS CLI, SDKs, or CloudWatch Agent) to publish application-specific metrics. For example, RequestCount, ErrorRate, ProcessingTime for specific microservices or API endpoints. Ensure you add relevant dimensions (e.g., ServiceName, APIPath, ContainerId) that you can later use for grouping in Stackcharts. bash aws cloudwatch put-metric-data --namespace "MyApplication" --metric-name "OrderProcessingTime" --dimensions ServiceName=OrderService,Function=ProcessOrder --value 150 --unit Milliseconds * Logs to Metrics: Leverage CloudWatch Logs Insights or metric filters to extract numerical values from your application logs and publish them as custom metrics. This is especially useful for older applications that log extensively but don't natively publish metrics. For instance, you could extract the duration of a specific transaction logged by your application and turn it into a metric that can then be stacked.
Practical Steps to Building Your First Stackchart
Let's walk through an example of creating a Stackchart to visualize the CPU utilization across multiple EC2 instances in an Auto Scaling Group.
- Add a Widget: On your CloudWatch Dashboard, click "Add widget."
- Select Widget Type: Choose "Line" for metric graphs. (Stackcharts are a variation of line/area graphs in CloudWatch).
- Choose Metrics: Click "Add metric."
- Navigate to "EC2" -> "Per-Instance Metrics".
- Search for "CPUUtilization".
- Select all the relevant EC2 instances you wish to monitor (or select the entire Auto Scaling Group if you've configured CloudWatch to aggregate metrics for it). For a true Stackchart, you'll need multiple instances.
- Configure Graph Type to Stacked Area:
- Once the metrics are added, in the graph display options (often a gear icon or "Graph Options" button), look for "Graph type."
- Change it from "Line" to "Stacked area." This is the crucial step that transforms individual line graphs into a Stackchart.
- Grouping by Dimensions: This is where the magic of Stackcharts truly shines for dynamically changing fleets.Example Query for Stackchart Configuration (Metric Search tab):
{ "AWS/EC2", "CPUUtilization", "InstanceId" }This will search forCPUUtilizationand allow you to group byInstanceId.Example using Metric Math for dynamic grouping: You can also use Metric Math for more advanced grouping, though the console's "Group by" feature is usually sufficient for common Stackcharts. If you're building a dashboard programmatically (e.g., with CloudFormation), you might define a metric widget with aperiodandstatand specify that it should be a "stacked area" graph type. Thelabelfield can often be configured with dynamic variables to show theInstanceIdfor each layer.- Instead of manually selecting each instance, you can use "Search" functionality for metrics. For example, search for
CPUUtilizationwithin theAWS/EC2namespace. - Then, you'll see a list of results. Crucially, under the "Group by" dropdown, select
InstanceId. This automatically creates a series for each uniqueInstanceIdpublishingCPUUtilizationin the selected time frame. - Ensure the
Statisticis set toSumorAveragedepending on your interpretation. For a Stackchart representing total contribution,Sumis often appropriate (e.g., total CPU units consumed), while for per-instance comparison within the stack,Averagemight be used for each layer, but the sum of averages is not the total. Usually, for stacked area, you want the sum of individual values. So each layer represents theAverageCPU of one instance, and the total stack height is the sum of these averages across the fleet.
- Instead of manually selecting each instance, you can use "Search" functionality for metrics. For example, search for
- Aggregation Techniques:
- Sum: Ideal for metrics where you want to see the total collective contribution (e.g., total
Invocationsfor a group of Lambda functions, totalNetworkOutbytes for an EC2 fleet). Each layer represents the individual resource's sum for the period, and the entire stack represents the sum of all individual sums. - Average: Less common for the direct stacking of raw values, but useful if your custom metrics are already per-unit averages and you want to visualize how their average contribution stacks up. Be mindful of what "average of averages" means in your context.
- Max/Min: Rarely used for Stackcharts as they obscure the cumulative effect, but useful for identifying outliers within a time slice if combined with other visualization types.
- Sum: Ideal for metrics where you want to see the total collective contribution (e.g., total
- Time-series Analysis and Granularity: Adjust the time range (e.g., 1 hour, 3 hours, 1 day) and period (granularity of data points, e.g., 1 minute, 5 minutes) to suit your analysis needs. Finer granularity shows more detail but can be noisy over long periods.
Advanced Stackchart Techniques
- Cross-account/Cross-region Monitoring: If you have centralized monitoring accounts, you can create Stackcharts that pull metrics from different AWS accounts or regions into a single dashboard using CloudWatch cross-account observability features. This is critical for global applications.
- Combining Different Service Metrics: While typically Stackcharts visualize the same metric across different dimensions, you can strategically combine different, but related, metrics if their units and scale are compatible and contribute to a logical total. For example, stacking different types of
ByteCountmetrics (NetworkIn,NetworkOut,DiskReadBytes,DiskWriteBytes) might give a consolidated view of I/O activity. - Anomaly Detection Overlays: Enhance your Stackcharts by overlaying CloudWatch's Anomaly Detection bands. This allows you to visually identify when the entire stack's behavior (or even an individual layer's behavior, if configured for that specific metric) deviates from its learned baseline, drawing immediate attention to unusual operational patterns.
- Custom Widgets and Expressions: For very specific or dynamic use cases, you can create custom widgets using Metric Math expressions that generate the desired series for stacking. This offers maximum flexibility.
Integrating Stackcharts with Alarms and Actions
While Stackcharts provide visual insights, it's crucial to integrate them with CloudWatch Alarms for automated notification and response. * Aggregate Alarms: Create alarms on the total sum or average of the stacked metric. For example, if the sum of CPU Utilization across your Auto Scaling group exceeds 80%, trigger an alarm to scale out. * Per-Resource Alarms: While Stackcharts visualize individual contributions, you can still set individual alarms for each resource (e.g., if any single EC2 instance's CPU utilization exceeds 95% for too long, indicating a "hot" instance despite the group average being fine). The Stackchart helps identify these anomalies visually, and the alarm automates detection.
Best Practices for Naming Conventions and Organization
- Clear Names: Give your dashboards and widgets descriptive names that clearly indicate what they are monitoring.
- Logical Grouping: Organize Stackcharts and other widgets logically on your dashboard. Group related services or application components together.
- Consistent Dimensions: When publishing custom metrics, use consistent dimension names across all related metrics to simplify grouping and filtering for Stackcharts.
- Documentation: Document your dashboards, especially complex Stackcharts, to ensure other team members understand their purpose and how to interpret them.
By following these practical steps and embracing best practices, you can effectively implement CloudWatch Stackcharts and transform your AWS monitoring from a reactive chore into a powerful, proactive engine for deeper AWS insights.
Unlocking Deeper AWS Insights with Stackcharts: Use Cases and Benefits
CloudWatch Stackcharts are more than just aesthetically pleasing visualizations; they are powerful analytical tools that empower engineers and operations teams to unlock deeper AWS insights across critical operational domains. Their ability to simultaneously display individual contributions and group aggregates provides an unparalleled perspective on system behavior, driving significant benefits in performance optimization, cost management, troubleshooting, and capacity planning.
Performance Optimization: Pinpointing Bottlenecks with Granular Data
One of the most immediate and impactful applications of Stackcharts is in performance optimization. In complex distributed systems, identifying performance bottlenecks can be like finding a needle in a haystack. Stackcharts simplify this process by providing a visual breakdown of resource utilization across a fleet.
- EC2 CPU/Memory Utilization Across a Fleet: Imagine an Auto Scaling Group with 50 EC2 instances. A traditional graph of average CPU might show a healthy 40% utilization. However, a Stackchart of
CPUUtilizationgrouped byInstanceIdmight reveal that five instances are consistently at 90% CPU while the rest are at 10-20%. This immediate visual cue indicates an uneven load distribution, potentially due to sticky sessions, an inefficient load balancer algorithm, or a few "hot" instances processing specific, resource-intensive requests. This insight allows targeted intervention, such as rebalancing load, investigating application-level issues on those specific instances, or adjusting instance types. Similarly, a Stackchart ofMemoryUtilization(if collected via CloudWatch Agent) can highlight instances nearing memory exhaustion, even if the fleet average remains low. - RDS Connection Counts and Latency Spikes: For databases like Amazon RDS, monitoring connection counts is crucial. If multiple applications or microservices connect to a single database, a Stackchart of
DatabaseConnections(with a custom dimension forApplicationNameorClientService) would immediately show which application is consuming the most connections. A sudden spike in one application's layer could indicate a connection leak or an unusually high load, potentially affecting other services. Combined withDatabaseConnectionsMaxas an upper limit, this visualization helps prevent database connection saturation, a common cause of performance degradation. Similarly, a Stackchart of different SQL query types' latency, if custom metrics are published, can pinpoint specific slow operations. - Lambda Invocation Patterns and Duration Variability: In serverless architectures, performance is often measured by function duration and invocation rates. A Stackchart displaying
DurationorInvocationsfor a group of related Lambda functions (e.g., all functions within a specific microservice) grouped byFunctionNameprovides an instant visual aggregate. You can quickly see which functions contribute most to the total execution time or receive the highest traffic. If a single function's layer in theDurationStackchart suddenly thickens, it points directly to a performance degradation within that specific function, even if the overall service latency remains within acceptable bounds due to other functions performing well. This granular view is indispensable for optimizing serverless costs and performance.
Cost Management and Resource Utilization: Identifying Waste and Opportunities
Stackcharts are invaluable tools for cost management and resource utilization by providing clarity on where resources are being consumed and if they are being used efficiently. AWS costs are often directly tied to resource usage, and over-provisioning or inefficient usage can lead to significant unnecessary expenditure.
- Tracking Underutilized Resources: By observing a Stackchart of
CPUUtilizationfor a fleet of EC2 instances, you can easily identify instances that consistently show very thin layers at the bottom of the stack, indicating low utilization. These are prime candidates for rightsizing to smaller instance types or even consolidation. Similarly, for storage services, a Stackchart ofStorageOccupancyacross different S3 buckets or EBS volumes (if custom metrics are pushed) can highlight underutilized storage that could be transitioned to cheaper tiers or decommissioned. - Understanding Usage Patterns for Rightsizing: Stackcharts help visualize peak and off-peak usage patterns across a group of resources. This understanding is critical for configuring Auto Scaling policies effectively and making informed decisions about reserved instances or savings plans. If a Stackchart shows consistently low utilization across an entire fleet for extended periods, it suggests an opportunity to reduce the minimum desired capacity of an Auto Scaling Group or even restructure the application to be more elastic.
- Predicting Future Resource Needs: By observing long-term trends in Stackcharts, particularly the overall height of the stack, organizations can anticipate future resource requirements. A steady upward trend in total CPU utilization or total Lambda invocations, even if individual components fluctuate, indicates a growing demand that will eventually necessitate scaling out or rightsizing to larger resources proactively, avoiding future performance degradation.
Troubleshooting and Root Cause Analysis: Accelerating Incident Response
When an incident occurs, time is of the essence. Stackcharts significantly accelerate troubleshooting and root cause analysis by providing immediate visual context and correlation.
- Correlating Metrics from Interdependent Services: Imagine a web application where users report slow load times. With Stackcharts, you can create a dashboard that shows:
- A Stackchart of
TargetConnectionErrorCountfor your Application Load Balancer targets, grouped by target ID. - A Stackchart of
CPUUtilizationfor your EC2 instances, grouped by instance ID. - A Stackchart of
DatabaseConnectionsfor your RDS instance, grouped byClientService. A spike in ALB target errors might coincide with a rise in CPU on one or two EC2 instances, which then correlates with a proportional increase in database connections from those same instances. This multi-Stackchart view provides a powerful narrative, quickly pointing towards an overloaded application component on specific instances impacting downstream services, rather than a generic network issue or database problem.
- A Stackchart of
- Visualizing System-wide Health at a Glance: A dashboard populated with key Stackcharts acts as an "executive summary" of your system's operational health. A quick glance can reveal if there's an uneven load, a sudden increase in a particular component's contribution, or an overall surge in resource consumption. This immediate visual anomaly detection saves critical time during outages.
- Rapid Identification of Outliers and Anomalies: The layered nature of Stackcharts naturally highlights outliers. A single "hot" layer within an otherwise stable stack immediately draws attention. This makes it incredibly easy to spot an instance, container, or function that is misbehaving, consuming excessive resources, or experiencing errors, allowing for targeted investigation rather than broad, unfocused debugging.
Capacity Planning: Proactive Scaling and Resource Provisioning
For proactive operations, Stackcharts are invaluable for capacity planning. By visualizing historical usage patterns and trends across groups of resources, teams can make informed decisions about future scaling strategies and resource provisioning. This moves organizations from reactive scaling to predictive resource management, preventing future performance issues and ensuring service continuity.
Enhancing Operational Resilience and Reliability
By providing such detailed and contextualized insights, Stackcharts ultimately contribute to enhancing operational resilience and reliability. They enable teams to: * Catch subtle performance degradations before they become critical incidents. * Understand the blast radius of component failures more accurately. * Validate the effectiveness of scaling policies and architectural changes. * Maintain a higher level of confidence in the health and performance of their AWS environments.
The Role of APIPark in Complementing AWS Monitoring
While CloudWatch Stackcharts excel at providing infrastructure and service-level insights within the AWS ecosystem, modern application architectures increasingly rely on APIs, especially with the proliferation of AI and microservices. Managing, monitoring, and analyzing the performance and usage of these APIs, particularly in hybrid or multi-cloud scenarios where API traffic flows through a dedicated gateway, requires specialized tools that complement AWS's native monitoring capabilities.
This is precisely where platforms like APIPark [https://apipark.com/] come into play. APIPark is an open-source AI Gateway and API Management platform designed to streamline the integration, management, and deployment of both AI and REST services. While CloudWatch Stackcharts give you deep insights into the underlying AWS resources (like EC2 CPU or Lambda durations), APIPark focuses on the API layer itself. It offers a unified management system for authentication, cost tracking, and, critically, detailed API call logging and powerful data analysis on API usage.
For organizations that leverage numerous AI models or expose a multitude of internal and external APIs, APIPark provides: * Unified API Format and Quick Integration: It standardizes AI invocation across 100+ models, ensuring application changes don't affect underlying AI models or prompts. * Prompt Encapsulation into REST API: Users can quickly create new APIs (e.g., sentiment analysis) by combining AI models with custom prompts. * End-to-End API Lifecycle Management: From design to decommission, APIPark helps manage traffic forwarding, load balancing, and versioning, which are essential for stable API operations. * Detailed API Call Logging: Every API call is recorded, allowing businesses to quickly trace and troubleshoot issues at the API level – a crucial layer of debugging that CloudWatch (on its own) would only provide indirectly through infrastructure metrics. * Powerful Data Analysis: APIPark analyzes historical call data to display long-term trends and performance changes specific to API usage, such as latency, throughput, and error rates per API endpoint. These are key metrics that complement the resource-centric views offered by CloudWatch Stackcharts.
For example, a CloudWatch Stackchart might show a spike in EC2 CPU utilization (underlying the API Gateway), while APIPark's analytics could pinpoint which specific API endpoint or which AI model invocation is causing that load. This symbiotic relationship between AWS monitoring tools like CloudWatch Stackcharts and specialized API management platforms like APIPark ensures a truly comprehensive cloud observability strategy, covering both the infrastructure and the application/API layers, unlocking an even deeper AWS insights picture.
Advanced Strategies for Maximizing Stackchart Value
To truly harness the full potential of CloudWatch Stackcharts and transform your AWS monitoring capabilities, it's essential to move beyond basic implementation and adopt advanced strategies. These techniques enhance the utility, automation, and contextual richness of your Stackcharts, embedding them deeply within your operational workflows and decision-making processes.
Custom Dashboards for Different Personas (DevOps, SRE, Business)
Not all stakeholders require the same level of detail or focus on the same metrics. Tailoring dashboards with specific Stackcharts for different personas can significantly improve their effectiveness and relevance.
- DevOps/SRE Teams: These teams need highly granular, real-time Stackcharts for troubleshooting and performance tuning. Their dashboards might include Stackcharts for per-instance CPU/memory, Lambda durations, container resource utilization, and database connection pools, allowing them to pinpoint bottlenecks and resource contention rapidly. They might also include Stackcharts showing error rates grouped by service or component, aiding in swift incident response.
- Development Teams: Developers might benefit from Stackcharts that focus on application-specific metrics. For instance, a Stackchart showing the latency of different API endpoints grouped by feature, or the number of messages processed by various queues grouped by consumer service. This helps them understand the operational impact of their code changes and identify areas for optimization within their applications.
- Business Stakeholders: While less interested in raw CPU numbers, business users could leverage Stackcharts that abstract technical metrics into business-relevant KPIs. For example, a Stackchart showing customer orders processed per region, user sign-ups per microservice, or even revenue generated per application component. This provides a visual representation of the contribution of different parts of the business to the overall performance, linking operational health directly to business outcomes. This approach moves cloud observability beyond pure technical metrics into strategic business intelligence, leveraging the visual power of Stackcharts to communicate complex information in an easily digestible format.
Programmatic Dashboard Creation and Management (CloudFormation, Terraform)
Manually creating and maintaining complex CloudWatch Dashboards, especially those with numerous Stackcharts and custom configurations, can be tedious, error-prone, and not scalable. Adopting Infrastructure as Code (IaC) principles to define your dashboards is a best practice that ensures consistency, version control, and automation.
- AWS CloudFormation: CloudFormation allows you to define your CloudWatch Dashboards as JSON or YAML templates. This includes specifying widgets, metric configurations (including
statandperiod), and graph properties likestackedorstacked-area. By defining dashboards in CloudFormation, you can deploy them consistently across multiple environments (development, staging, production) and regions, ensuring that your AWS monitoring is standardized. Any changes can be reviewed, versioned, and rolled out through your CI/CD pipelines, treating your monitoring infrastructure like any other part of your application. - Terraform: Similarly, HashiCorp Terraform provides resources for managing CloudWatch Dashboards. You can define
aws_cloudwatch_dashboardresources and configure theirdashboard_bodywith JSON that specifies your Stackcharts. Terraform's declarative nature makes it easy to manage the lifecycle of these dashboards, ensuring they are always in the desired state. This programmatic approach significantly reduces operational overhead and enhances the reliability of your monitoring setup, enabling faster iteration and adaptation to evolving architectural needs.
Integrating with Other AWS Services (X-Ray, ServiceLens)
For a truly comprehensive cloud observability strategy, Stackcharts should not operate in isolation. Integrating them with other AWS observability services provides a more holistic and actionable view.
- AWS X-Ray: X-Ray provides end-to-end tracing for requests as they travel through your distributed applications. While Stackcharts show you what is happening (e.g., high CPU on an instance), X-Ray can show you why by providing the full trace of requests hitting that instance, including latencies at each hop, errors, and specific service calls. A common advanced pattern is to use Stackcharts to identify an anomaly (e.g., a thick layer for a specific Lambda function's duration) and then immediately jump to X-Ray traces for that function to understand the precise code path or external dependency causing the slowdown.
- CloudWatch ServiceLens: ServiceLens brings together metrics, logs, and traces (from X-Ray) into a single, unified service map. Stackcharts can be embedded within ServiceLens dashboards or viewed alongside ServiceLens insights. This integration allows you to see the aggregate health of your services via Stackcharts, then drill down into specific service health using ServiceLens's service map, and finally inspect individual request traces with X-Ray, all from a centralized view. This synergy significantly enhances deeper AWS insights by providing both a macro and micro perspective on your application's performance and health.
Leveraging Metric Math and Anomaly Detection
Advanced Stackcharts can be made even more powerful by incorporating Metric Math and CloudWatch Anomaly Detection.
- Metric Math: Beyond simple aggregation, Metric Math allows you to perform complex calculations on existing metrics to derive new insights. For example, you could create a Stackchart showing the ratio of error invocations to total invocations for each Lambda function within a service. This gives you an error rate per function, stacked to show which functions are contributing most to the overall error budget. You could also use Metric Math to normalize metrics or combine different units into a single logical view.
- Anomaly Detection: Overlaying Anomaly Detection bands directly onto your Stackcharts (for individual layers or the aggregate stack) provides real-time, machine learning-driven anomaly identification. Instead of relying on static thresholds (which can be difficult to set for dynamic systems), Anomaly Detection automatically learns the normal behavior of your metric and highlights deviations. This significantly reduces alert fatigue and ensures that true, statistically significant anomalies are surfaced immediately, allowing your teams to proactively address issues before they escalate, further deepening AWS monitoring capabilities.
The Future of AWS Cloud Observability and Stackcharts' Role
The landscape of cloud observability is continually evolving, with increasing emphasis on AI/ML-driven insights, automated remediation, and holistic, end-to-end visibility across hybrid and multi-cloud environments. Stackcharts are perfectly positioned to adapt and thrive in this future:
- Enhanced AI/ML Integration: Expect tighter integration with advanced ML models for predictive insights, not just anomaly detection. Stackcharts could visualize predicted future resource usage, allowing for proactive scaling and cost optimization.
- Cross-Environment Observability: As organizations embrace multi-cloud and hybrid cloud strategies, Stackcharts could evolve to display metrics from various cloud providers or on-premises environments, providing a unified stacked view of resource consumption across the entire enterprise.
- Focus on Business Value: The trend towards linking operational metrics directly to business outcomes will continue. Stackcharts will play a crucial role in visualizing these business-level metrics, showing how different components contribute to revenue, customer satisfaction, or operational efficiency.
Continuous Improvement: Iterative Refinement of Monitoring Strategies
Mastering CloudWatch Stackcharts and AWS monitoring is an ongoing journey, not a one-time setup. Organizations should adopt an iterative approach to their monitoring strategy:
- Review Regularly: Periodically review your dashboards and Stackcharts. Are they still providing the most relevant insights? Are there new services or features that need monitoring?
- Gather Feedback: Collect feedback from developers, SREs, and business users on the utility of the dashboards. What information is missing? What is confusing?
- Optimize Alarms: Ensure alarms are tuned appropriately to minimize false positives and negatives. Use Anomaly Detection to refine thresholds.
- Automate Everything: Wherever possible, use IaC tools to manage dashboards, alarms, and custom metric definitions.
By embracing these advanced strategies and fostering a culture of continuous improvement, organizations can maximize the value derived from CloudWatch Stackcharts, achieving an unparalleled level of cloud observability and unlocking truly deeper AWS insights that drive operational excellence and business success.
The Transformative Power of Stackcharts
In the labyrinthine world of modern cloud computing, where architectural complexity scales with innovation, the quest for profound operational clarity is ceaseless. AWS CloudWatch has long stood as the foundational pillar for AWS monitoring, collecting the vital telemetry that keeps cloud environments functioning. However, as systems evolved from monolithic structures to intricate tapestries of microservices, containers, and serverless functions, the limitations of traditional, atomized metric visualization became glaringly apparent. It became increasingly difficult to discern the forest for the trees, to understand the collective behavior and individual contributions within vast fleets of dynamic resources.
This is precisely the chasm that CloudWatch Stackcharts bridge with elegant simplicity and formidable analytical power. By visually stacking individual metric series, Stackcharts have fundamentally transformed the way organizations achieve deeper AWS insights. They move beyond mere aggregation, providing a dynamic compositional view that simultaneously reveals the total system load and the precise contribution of each component to that load. This unique perspective allows engineers to swiftly identify hot spots, understand load distribution, and correlate events across interdependent services with a clarity previously unattainable through disparate graphs.
The journey we've undertaken through the mechanics and applications of Stackcharts underscores their multifaceted value. From optimizing the performance of EC2 fleets and Lambda functions to meticulously managing cloud costs by identifying underutilized resources, and from accelerating the often-stressful process of troubleshooting incidents to proactively planning for future capacity, Stackcharts prove to be an indispensable asset. They empower teams to transition from a reactive posture, where issues are addressed only after they manifest, to a proactive stance, anticipating and mitigating challenges before they impact users or business objectives. This shift is not merely operational; it is strategic, bolstering the resilience and reliability of cloud-native applications.
Furthermore, in the context of modern, API-driven architectures, the power of CloudWatch Stackcharts is brilliantly complemented by specialized platforms like APIPark [https://apipark.com/]. While Stackcharts provide unparalleled visibility into the underlying AWS infrastructure and its performance, APIPark steps in to offer equally deep, focused insights into the API layer itself – critical for managing, observing, and optimizing the flow of data through AI and REST services. This synergy ensures a truly holistic cloud observability strategy, covering every layer from infrastructure to application-specific API interactions, thus unlocking an even more comprehensive and actionable understanding of your entire digital ecosystem.
The mastery of AWS monitoring is an ongoing pursuit, demanding continuous adaptation and the adoption of sophisticated tools. CloudWatch Stackcharts are not just another feature; they are a transformative lens, allowing teams to peer into the heart of their AWS environments with unprecedented precision. Embracing and optimizing their use is a definitive step towards achieving operational excellence, driving informed decisions, and ultimately building more robust, efficient, and performant cloud architectures for the future. The path to deeper AWS insights is paved with well-crafted Stackcharts, illuminating the intricate dance of your cloud resources and guiding you towards unparalleled success.
Frequently Asked Questions (FAQ)
1. What exactly is a CloudWatch Stackchart and how does it differ from a regular line graph? A CloudWatch Stackchart is a type of area graph where multiple data series are "stacked" on top of each other, allowing you to visualize both the individual contribution of each series and their cumulative total over time. Unlike a regular line graph which shows each series as a separate, often overlapping, line, a Stackchart explicitly shows how each component contributes to a whole, making it easier to identify proportions, distributions, and outliers within a group of related resources (e.g., CPU utilization of individual EC2 instances in a fleet).
2. Why are Stackcharts particularly useful for monitoring complex AWS environments? Complex AWS environments, characterized by numerous microservices, serverless functions, and Auto Scaling groups, generate a vast amount of metric data from many similar resources. Stackcharts help condense this complexity by grouping related metrics (e.g., CPU for all instances, invocations for all Lambda functions in a service) into a single, cohesive visualization. This allows engineers to quickly grasp the overall health and performance distribution across a fleet, pinpoint "hot" or "cold" resources, and identify uneven load patterns that would be difficult to spot by looking at dozens of individual graphs.
3. Can I use Stackcharts to monitor custom application metrics, not just native AWS service metrics? Yes, absolutely. CloudWatch Stackcharts can visualize any metric published to CloudWatch, including custom metrics from your applications. To do this effectively, ensure your custom metrics are published with relevant dimensions (e.g., ServiceName, APIPath, ContainerId). These dimensions can then be used to group and stack your metrics in a Stackchart, providing a breakdown of your application's internal behavior, such as latency or error rates per microservice or API endpoint.
4. How do Stackcharts assist with cost optimization in AWS? Stackcharts provide critical visual insights into resource utilization across groups of resources. By stacking metrics like CPU, memory, or network I/O, you can easily identify individual instances or components that are consistently underutilized (showing thin layers at the bottom of the stack) or overutilized. This visual evidence empowers you to make informed decisions about rightsizing resources, adjusting Auto Scaling group policies, or identifying idle resources that can be decommissioned, directly leading to significant cost savings.
5. How does APIPark complement CloudWatch Stackcharts for a comprehensive monitoring strategy? CloudWatch Stackcharts provide deep insights into the underlying AWS infrastructure and resource performance (e.g., EC2 CPU, Lambda durations). However, for applications heavily reliant on APIs, especially those involving AI models, specialized monitoring at the API layer is crucial. APIPark [https://apipark.com/] acts as an open-source AI Gateway and API Management platform that offers detailed API call logging, robust data analysis on API usage (latency, throughput, errors per API endpoint), and comprehensive API lifecycle management. This means while CloudWatch Stackcharts show you how your infrastructure is performing, APIPark tells you how your APIs are performing and which specific API calls are consuming resources, offering a complete, end-to-end observability strategy for both the infrastructure and application layers.
🚀You can securely and efficiently call the OpenAI API on APIPark in just two steps:
Step 1: Deploy the APIPark AI gateway in 5 minutes.
APIPark is developed based on Golang, offering strong product performance and low development and maintenance costs. You can deploy APIPark with a single command line.
curl -sSO https://download.apipark.com/install/quick-start.sh; bash quick-start.sh

In my experience, you can see the successful deployment interface within 5 to 10 minutes. Then, you can log in to APIPark using your account.

Step 2: Call the OpenAI API.