Deep Dive into Logging Header Elements Using eBPF
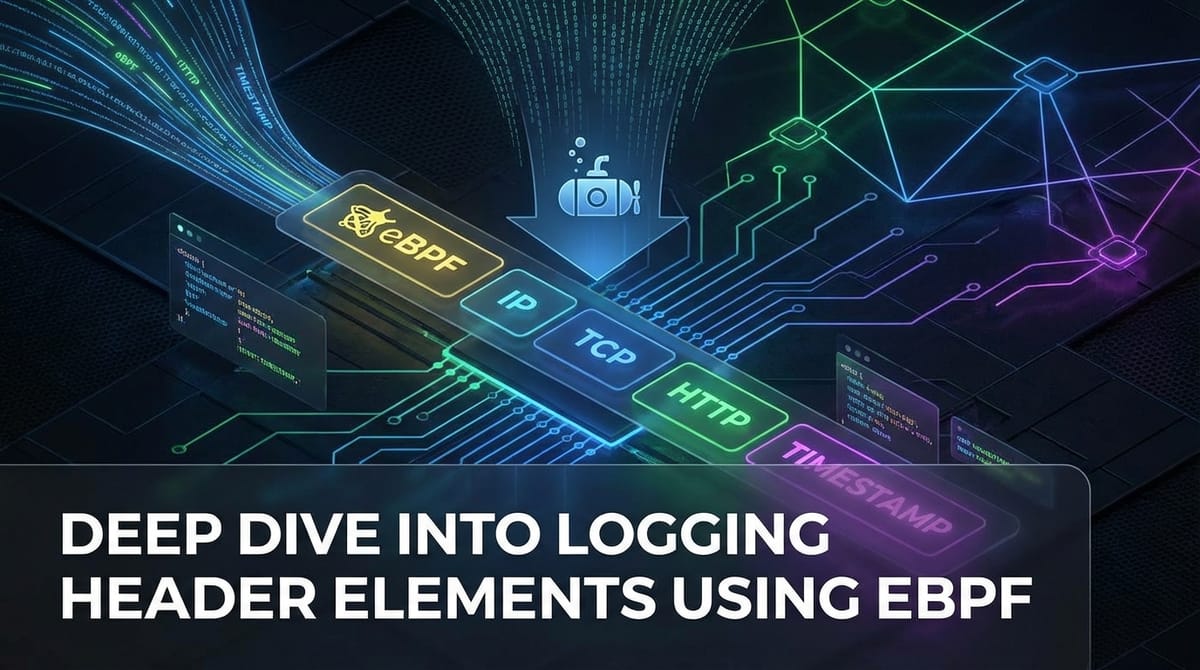


In the intricate tapestry of modern distributed systems, where microservices communicate incessantly and cloud-native architectures reign supreme, visibility is not merely a feature – it is the bedrock of reliability, security, and performance. Without a comprehensive understanding of what transpires within and between these interconnected components, diagnosing issues becomes a Sisyphean task, and ensuring robust operation an impossible dream. Traditional logging mechanisms, while indispensable, often grapple with limitations, particularly when it comes to capturing the nuanced, yet profoundly critical, information embedded within HTTP header elements. These headers, often fleeting and invisible to the naked eye, carry the very essence of a request's intent, context, and security posture.
The challenge lies in gleaning these insights with minimal overhead and maximum fidelity, without resorting to invasive code changes or resource-intensive network captures. This is where Extended Berkeley Packet Filter (eBPF) emerges not just as a powerful tool, but as a paradigm shift. eBPF, a revolutionary technology that allows sandboxed programs to run in the Linux kernel, offers an unprecedented vantage point into system events, network traffic, and application behavior, all without modifying kernel source code or loading kernel modules. For organizations reliant on robust api interactions and sophisticated api gateway deployments, the ability to peer into the kernel's processing of network requests and responses opens up a new frontier for observability.
This article embarks on a deep dive into how eBPF can be leveraged to achieve unparalleled insights into HTTP and api header elements. We will explore the critical role headers play, dissect the shortcomings of conventional logging, illuminate the transformative capabilities of eBPF, and then meticulously detail practical approaches for employing eBPF to log header data. Our journey will reveal how this cutting-edge technology can empower developers, security engineers, and operations teams with granular, low-overhead introspection, fostering more resilient, secure, and performant systems in an increasingly api-driven world. The ultimate goal is to illuminate how eBPF fundamentally changes the game for api and api gateway logging, offering a future where no critical piece of header information remains unobserved.
The Ubiquity and Importance of Headers in Modern APIs
At the heart of virtually every internet interaction lies the Hypertext Transfer Protocol (HTTP), and within HTTP, headers serve as the unsung heroes, carrying vital metadata that orchestrates the entire communication dance. These key-value pairs, transmitted before the actual message body, provide context, instructions, and authentication details that are absolutely indispensable for the proper functioning of web services and, more specifically, modern apis. Understanding and effectively logging these header elements is not just good practice; it's a critical requirement for debugging, security, performance optimization, and compliance in any system that heavily relies on api interactions.
HTTP headers are broadly categorized into request headers (sent by the client to the server) and response headers (sent by the server back to the client). Request headers inform the server about the client's capabilities, preferred language, authentication credentials, and the specifics of the resource being requested. For instance, an Authorization header carries tokens that verify the client's identity, while an Accept header indicates the media types the client can process. Conversely, response headers provide the client with information about the server's capabilities, the status of the request, caching instructions, and metadata about the resource returned. Examples include Content-Type specifying the format of the response body, Cache-Control dictating caching policies, and Set-Cookie for managing user sessions.
The critical importance of headers stems from their multifaceted roles across various aspects of api functionality:
- Authentication and Authorization: Perhaps the most sensitive and crucial role, headers like
Authorization(e.g., Bearer tokens for OAuth2, Basic authentication) are fundamental for securingapis. Logging these headers (or at least their presence and type, carefully avoiding logging sensitive values) is vital for auditing access, detecting unauthorized attempts, and tracing security incidents. In anapi gatewaycontext, these headers are often the first line of defense, validating identity before forwarding requests. - Content Negotiation: Headers such as
Accept,Accept-Language,Accept-Encoding, andContent-Typeenable clients and servers to agree on the format, language, and encoding of the data being exchanged. Proper logging of these helps in understanding client preferences, identifyingapicompatibility issues, and ensuring services deliver optimal content. - Caching:
Cache-Control,ETag,Last-Modified, andExpiresheaders are pivotal for optimizing performance by allowing clients and intermediaries (like proxies or CDNs) to store and reuse responses. Logging these headers helps in validating caching strategies, diagnosing cache misses, and ensuringapiresponses are served efficiently without overloading backend services. - Traffic Routing and Load Balancing: In complex architectures, especially those involving an
api gateway, headers likeHost,X-Forwarded-For,X-Real-IP, and custom routing headers dictate how requests are directed to specific backend services or versions. Observing these headers is crucial for debugging routing logic, understanding traffic distribution, and ensuring requests reach their intended destinations. Anapi gatewayheavily relies on these headers to perform its core functions. - Distributed Tracing and Correlation: Headers like
X-Request-ID,Trace-ID, andSpan-ID(often standardized by OpenTelemetry or similar specifications) are essential for tracking a single request as it traverses multiple microservices. Logging these correlation IDs across all service boundaries, especially at theapi gatewayentry point, is paramount for end-to-end observability and quickly pinpointing performance bottlenecks or errors in a distributedapicall chain. - Rate Limiting and Throttling: Many
apis implement rate limits, and the associated headers (e.g.,X-RateLimit-Limit,X-RateLimit-Remaining,X-RateLimit-Reset) communicate these policies to clients. Logging these can help in understandingapiconsumption patterns, identifying clients hitting limits, and optimizingapiusage. - Client/User Agent Identification: The
User-Agentheader provides information about the client software making the request. This can be used for analytics, identifying specific application versions, detecting bots, or tailoring responses for different client capabilities. - Security and Compliance: Beyond authentication, headers like
Strict-Transport-Security(HSTS),X-Content-Type-Options,X-Frame-Options, andContent-Security-Policyare critical for enforcing various security policies against common web vulnerabilities. Logging their presence and correct values helps ensure that these security measures are properly applied at theapilevel.
Given this extensive range of functions, the absence of comprehensive header logging creates significant blind spots. Imagine trying to debug an api authentication failure without knowing if the Authorization header was present or correctly formatted, or diagnosing a caching issue without seeing the Cache-Control directives. This lack of visibility can lead to extended mean time to resolution (MTTR), security vulnerabilities, performance degradation, and a general erosion of trust in the system's reliability. The challenge, however, is to capture this wealth of information without incurring prohibitive performance costs or exposing sensitive data through insecure logging practices. This is where the limitations of traditional logging approaches become apparent.
Limitations of Traditional Logging Approaches for Headers
While indispensable, traditional logging mechanisms often fall short when it comes to capturing HTTP header elements with the granularity, low overhead, and comprehensive scope required for modern, high-performance api and api gateway environments. These approaches typically involve injecting logging logic at different layers of the system, each with its own set of advantages and inherent drawbacks. Understanding these limitations is crucial for appreciating the transformative potential of eBPF.
Application-Level Logging
The most common and often easiest approach is to instrument the application code itself to log incoming request headers and outgoing response headers. This involves adding explicit log statements within the application's handlers or middleware.
Pros: * Ease of Implementation: For developers, inserting log.info(request.headers) or similar commands into their preferred programming language framework (e.g., Express.js, Spring Boot, FastAPI, Flask) is straightforward. * Contextual Richness: Application-level logging provides access to headers after they have been parsed by the application server, often alongside application-specific context (e.g., user ID after authentication, internal processing time). This can be highly valuable for debugging application logic specific to an api endpoint. * Selective Logging: Developers can choose precisely which headers to log and can implement logic to redact sensitive information (e.g., Authorization tokens) before logging.
Cons: * Requires Code Modification and Redeployment: Any change to logging requirements, such as adding a new header to be logged or changing redaction rules, necessitates modifying the application code, recompiling (if applicable), testing, and redeploying. This is slow, error-prone, and adds operational overhead. * Language and Framework Dependence: Logging logic is tied to the specific programming language and framework used by each microservice. This leads to inconsistencies in logging formats, semantics, and capabilities across a diverse polyglot api ecosystem. * Performance Impact: Extensive application-level logging, especially of numerous headers, can introduce measurable performance overhead due to string formatting, I/O operations, and CPU cycles spent on logging. In high-throughput api environments, this can quickly become a bottleneck. * Blind Spots: Application-level logging only captures events that successfully reach the application layer. It provides no visibility into issues occurring earlier in the request lifecycle, such as network connectivity problems, api gateway misconfigurations, load balancer errors, or malformed requests that are dropped before reaching the application code. For example, a client request might be rejected by the api gateway due to an invalid API key in the Authorization header, and the application itself would never see this request. * Security Concerns: If not implemented carefully, application logs can inadvertently expose sensitive data if redaction rules are missed or flawed, leading to potential data breaches.
Proxy/Load Balancer Logging (API Gateway Context)
In modern architectures, requests often pass through one or more intermediate layers like a reverse proxy, load balancer, or dedicated api gateway before reaching the backend application. These components, such as Nginx, Envoy, or specialized api gateway products, typically offer their own logging capabilities.
Pros: * Centralized Logging: Logging at the api gateway or proxy level provides a centralized point of observation for all incoming api traffic, irrespective of the backend service's technology stack. This is particularly valuable for gaining an overview of api usage and health. * Early Visibility: Headers can be captured before they even touch the backend application. This is crucial for understanding traffic that never reaches the application due to api gateway policies (e.g., authentication failures, rate limiting, routing errors). * Reduced Application Overhead: Moving logging concerns away from individual applications can reduce their computational burden, allowing them to focus purely on business logic. * Consistency: Logs from a single api gateway instance tend to be consistent in format and content, simplifying analysis.
Cons: * Configuration Complexity: Configuring detailed header logging on a proxy or api gateway can be complex, often requiring specific directives, custom log formats, or even scripting. Changes still require configuration updates and potentially restarts/reloads of the api gateway. * Limited Internal Context: While api gateways see external headers, they generally lack insight into headers added or modified within the application's internal processing flow or headers generated by downstream microservices. This creates a visibility gap between the api gateway and the actual service logic. * Vendor Lock-in/Feature Limitations: The extent and flexibility of header logging depend entirely on the features provided by the specific api gateway or proxy software. Custom or very specific logging requirements might not be easily met without extending the api gateway itself, which can be challenging or impossible. * Scalability Challenges: As api gateway traffic scales, the volume of logs generated can become immense, straining the gateway's I/O resources and the downstream logging infrastructure.
Network Packet Capture (e.g., Wireshark, tcpdump)
At the lowest level, tools like Wireshark or tcpdump can capture raw network packets directly from the wire or network interface.
Pros: * Ultimate Granularity: Packet capture tools provide unfiltered, raw network data, including every byte of every header. This offers the most complete picture of what is actually transmitted over the network for an api call. * Protocol Agnostic: They work at the network layer, making them independent of application protocols or technologies (though parsing HTTP requires specific dissectors). * No Application or Gateway Modification: Capturing packets does not require any changes to the application or api gateway code or configuration.
Cons: * Extremely High Overhead: Continuously capturing and processing raw packets in a production environment, especially for high-throughput api services, is prohibitively resource-intensive. It can severely impact server performance and generate colossal amounts of data, quickly exhausting storage. * Decryption Challenges: For HTTPS traffic, which constitutes the vast majority of modern api communication, packet capture tools cannot easily decrypt the payload without access to the server's private keys, which is often infeasible and a significant security risk. This renders most header data opaque. * Complexity and Expertise: Analyzing raw packet captures requires deep networking and protocol expertise, making it unsuitable for routine monitoring or operations. * Privacy and Security Risks: Capturing raw traffic, even if encrypted, carries significant privacy implications and could expose sensitive data if proper controls are not in place. * Not for Continuous Monitoring: Packet capture is generally reserved for targeted troubleshooting of specific, isolated incidents, not for continuous, production-scale observability of apis.
In summary, while traditional methods offer some level of header logging, they consistently struggle with balancing granularity, performance, ease of implementation, and comprehensive visibility across the entire request lifecycle. There's a persistent trade-off between invasiveness, overhead, and the depth of insight. This is precisely the gap that eBPF is designed to bridge, offering a non-invasive, high-performance, and deeply insightful approach to observability, including the critical task of logging HTTP header elements for api and api gateway operations.
Introducing eBPF: A Paradigm Shift in Observability
The journey to profound system visibility often feels like an unending quest for a better vantage point. For decades, developers and operators have relied on a combination of application instrumentation, kernel modules, and network sniffers, each bringing its own set of compromises. However, a seismic shift has occurred in the realm of Linux kernel programmability, heralding a new era for observability, security, and networking: Extended Berkeley Packet Filter, or eBPF.
At its core, eBPF is a revolutionary technology that allows sandboxed programs to run in the Linux kernel without changing kernel source code or loading kernel modules. Conceptually, it extends the capabilities of the original Berkeley Packet Filter (BPF), which was primarily designed for filtering network packets, by making the kernel itself programmable. This means that developers can write small, efficient programs that attach to various kernel events, such as network packet reception, system calls, function entries/exits within the kernel, and even user-space function calls. These programs execute directly within the kernel's execution context, granting them unparalleled access to system-level data and events.
The operation of eBPF is underpinned by a robust and secure architecture. When an eBPF program is loaded into the kernel, it first undergoes verification by an in-kernel verifier. This verifier ensures that the program is safe to run, cannot crash the kernel, will always terminate, and does not access arbitrary memory locations. Once verified, the eBPF bytecode is then Just-In-Time (JIT) compiled into native machine code for the host architecture, ensuring extremely efficient execution. This combination of safety and performance is what makes eBPF truly groundbreaking.
Key Benefits of eBPF for Observability
For the purpose of deep diving into logging header elements in api and api gateway environments, eBPF offers a compelling array of benefits that fundamentally transform our approach to observability:
- Low Overhead and High Performance: Since eBPF programs run directly in the kernel and are JIT-compiled, they execute with near-native speed. Unlike traditional methods that might involve context switching between user space and kernel space, or extensive data copying, eBPF minimizes overhead. This makes it ideal for high-throughput scenarios, such as monitoring busy
api gateways, where traditional logging or packet capture would introduce unacceptable latency or resource consumption. It enables continuous, deep observation without impacting the performance of the services being monitored. - Unprecedented Granularity and Depth: eBPF programs have direct access to kernel-level data structures, network packets as they traverse the network stack, and internal function calls within the kernel. This provides a level of detail and granularity that is simply unattainable through user-space tools or application-level logging alone. For logging header elements, this means the ability to inspect raw packets before they are fully processed, or to tap into the very functions that parse HTTP requests, offering a complete picture of the
apiinteraction. - Safety and Stability: The in-kernel verifier is a cornerstone of eBPF's design. It guarantees that eBPF programs cannot compromise kernel stability, preventing common pitfalls associated with traditional kernel modules that could potentially crash the entire system. This inherent safety makes eBPF a reliable choice for production environments, even when deployed for deep introspection.
- Non-Invasive and No Code Changes: One of eBPF's most powerful advantages is its non-invasiveness. It observes applications and the system externally, without requiring any modifications to application code, recompilation, or even changes to the
api gatewayconfiguration. This significantly reduces operational friction, allows for dynamic monitoring of third-party or legacy applications, and enables rapid deployment of new observability tools without disrupting existing services. This is a game-changer for monitoringapis across diverse technology stacks. - Dynamic and Flexible: eBPF programs can be loaded, attached, and detached dynamically at runtime. This flexibility allows operators to activate specific monitoring tools on demand, target particular processes or network interfaces, and adapt their observability strategy without system downtime. It enables on-the-fly debugging and transient data collection for specific
apidebugging scenarios. - Contextual Awareness: eBPF can correlate events across different layers of the system. For instance, it can link network events (like a new TCP connection) with process-level events (like a specific
api gatewayprocess handling that connection) and even user-space application logic (via uprobes). This holistic view is critical for understanding the full lifecycle of anapirequest and pinpointing where delays or errors occur.
eBPF's Role in API and API Gateway Monitoring
For apis and api gateways, eBPF's capabilities translate into direct, tangible benefits:
- Deep Packet Inspection at Near Wire Speed: Capture and analyze HTTP headers (and other protocol details) directly from the network stack, even for high-volume
apitraffic, without the performance hit oftcpdump. - Transparent
API GatewayInsight: Monitor internal operations of anapi gateway(e.g., Nginx, Envoy, or even specialized platforms like APIPark) by attaching uprobes to their critical functions, gaining insights into how they process requests, apply policies, and forward traffic, all without modifying theapi gatewayitself. - Security Auditing: Detect suspicious header patterns, malformed requests, or unauthorized access attempts at the kernel level, providing an early warning system that complements
api gatewaysecurity features. - Performance Troubleshooting: Pinpoint latency issues by precisely measuring time spent at different layers of the network and application stack, correlated with specific headers or
apiendpoints. - Cross-Service Visibility: Enhance distributed tracing by capturing correlation IDs from headers at the earliest possible point (e.g., ingress
api gateway) and associating them with subsequent kernel and application events.
In essence, eBPF moves the observability frontier much closer to the metal, offering a panoramic and detailed view of system behavior that was previously inaccessible or too costly to obtain. It transforms the kernel from a black box into a programmable, observable platform, setting a new standard for how we understand and manage complex api infrastructures. The subsequent sections will delve into the practical methodologies for harnessing this power to specifically log HTTP header elements, showcasing the tangible advantages eBPF brings to api and api gateway operations.
APIPark is a high-performance AI gateway that allows you to securely access the most comprehensive LLM APIs globally on the APIPark platform, including OpenAI, Anthropic, Mistral, Llama2, Google Gemini, and more.Try APIPark now! 👇👇👇
Diving Deep: Using eBPF for Logging Header Elements
Leveraging eBPF for logging header elements requires a strategic understanding of where to attach eBPF programs within the kernel and user space, and how to effectively parse and export the relevant data. The beauty of eBPF lies in its flexibility, allowing for various attachment points that cater to different observability goals, ranging from raw network packet inspection to granular insights into application-level processing within an api gateway. This section will detail the mechanisms and practical use cases, alongside the inherent challenges.
The Mechanism: Where and How eBPF Attaches
eBPF programs can hook into a multitude of kernel events, offering distinct vantage points for observing header data:
- Socket Filters (e.g.,
sock_filter): This is the most direct way to intercept network packets. An eBPF program can be attached to a socket, allowing it to inspect incoming and outgoing packets before they are fully processed by the network stack or before they are encrypted/decrypted. This is powerful for seeing raw HTTP requests and responses as they hit the network interface. The program can then filter packets and extract specific bytes corresponding to headers. - Kprobes (Kernel Probes): Kprobes allow eBPF programs to attach to virtually any function within the Linux kernel. This means an eBPF program can monitor functions responsible for network stack processing (e.g.,
tcp_recvmsg,ip_rcv), memory allocation, or even internal kernel communication related to network packets. By attaching to these functions, eBPF can gain access to kernel data structures that contain parsed network protocol information, potentially including HTTP headers as they are being identified. - Uprobes (User-Space Probes): While kprobes focus on the kernel, uprobes allow eBPF programs to attach to functions within user-space applications. This is incredibly valuable for gaining insights into the internal workings of an
api gatewayor a web server (e.g., Nginx, Envoy, Apache HTTPD). If anapi gatewayprocesses an HTTP request and stores its headers in a specific memory structure, an uprobe attached to the function that populates this structure can read those headers directly from theapi gateway's memory. This offers a post-decryption view of headers for HTTPS traffic, as theapi gatewaywould have already handled SSL/TLS.
How eBPF Parses HTTP Requests/Responses: Regardless of the attachment point, the eBPF program's core task is to extract header information. * Network Layer (Socket Filters/Kprobes): At this level, the eBPF program receives raw packet data. It must then perform basic HTTP parsing. This involves: * Identifying the TCP/IP header to locate the payload. * Reading the HTTP request line (e.g., GET /path HTTP/1.1) or status line (e.g., HTTP/1.1 200 OK). * Iterating through subsequent lines, parsing Header-Name: Header-Value pairs until an empty line signifies the end of headers. * This parsing logic needs to be carefully implemented within the eBPF program itself, adhering to the strict safety constraints of the eBPF verifier (e.g., bounded loops, no unbounded memory access). * Application Layer (Uprobes): When using uprobes on an api gateway or web server, the eBPF program doesn't typically parse raw packets. Instead, it accesses memory locations where the application has already parsed the HTTP headers and stored them in its own internal data structures (e.g., ngx_http_request_t in Nginx). This simplifies the eBPF program's logic significantly, as it only needs to know the layout of these structures and read specific fields.
Data Structures: Maps for Storing and Exporting Data: eBPF programs typically communicate extracted data to a user-space agent (written in Go, Python, C, etc.) using eBPF maps. * BPF_MAP_TYPE_PERF_EVENT_ARRAY: This is a common choice for sending event data (like captured headers) from the kernel to user space. It acts as a ring buffer where eBPF programs can perf_submit data, and a user-space application can perf_read it efficiently. * BPF_MAP_TYPE_HASH or ARRAY: These can be used for stateful operations within the kernel, for example, to store partial header data across multiple packet fragments or to maintain per-connection statistics before exporting them.
Practical eBPF Use Cases for Headers
The power of eBPF truly shines in its ability to address specific, high-value header logging scenarios for api and api gateway environments:
- Capturing Specific Critical Headers:
Authorization: Monitor the presence and type of authorization headers for allapicalls. While logging the full token is a security risk, observing the scheme (e.g.,Bearer,Basic) and length can provide insights into authentication attempts, even failed ones, at the earliest network stages.Content-Type: Ensureapiclients are sending correct content types, identify misconfigurations, or detect potential attack vectors if unexpected types are used.X-Request-ID/Trace-ID: Crucial for distributed tracing. eBPF can capture these IDs at theapi gatewayentry point, linking network-level events to application traces. This provides a robust foundation for end-to-end observability in a microservicesapiecosystem.User-Agent: Monitor client diversity, identify specific application versions interacting with theapi, or detect unusual user agents that might indicate bot activity or malicious scans.
- Filtering and Conditional Logging based on Headers:
- Security Auditing: Implement eBPF programs to only log requests that lack a required security header (e.g.,
Strict-Transport-Securityfor responses, or a customX-API-Keyfor requests). This proactively flags potential vulnerabilities or misconfigurations. - Error Diagnosis: Log requests only if they contain a specific error-related header, or if a response status code (derived from the response header) indicates an error (e.g.,
HTTP/1.1 500 Internal Server Error). This focuses logging on problematicapiinteractions. - Targeted Debugging: During an incident, activate eBPF logging to capture all headers for requests originating from a specific
X-Forwarded-ForIP address or destined for a particularHostheader.
- Security Auditing: Implement eBPF programs to only log requests that lack a required security header (e.g.,
- Latency Measurement Correlated with Headers:
- By attaching eBPF programs to both
tcp_recvmsg(start of request) andtcp_sendmsg(start of response), one can precisely measure the kernel-level network latency for eachapiinteraction. - This latency can then be correlated with specific header values (e.g., measuring latency for requests with a particular
User-Agentor forapis requiring specificContent-Typeprocessing) to identify performance bottlenecks at a granular level, even before the request reaches the application.
- By attaching eBPF programs to both
- Security Auditing and Anomaly Detection:
- Detect malformed HTTP headers that might indicate an attempted attack (e.g., HTTP Smuggling).
- Monitor for unusually long header values, which could be an indicator of buffer overflow attempts.
- Track the frequency of
Authorizationheader attempts from a single source IP to identify brute-force attacks on anapi.
- Rate Limiting Insights:
- Observe
X-RateLimit-Limit,X-RateLimit-Remaining,X-RateLimit-Resetheaders generated by theapi gatewayin responses. This provides a kernel-level view of howapirate limits are being applied and communicated to clients, independent ofapi gatewaylogs.
- Observe
Challenges and Considerations
While powerful, implementing eBPF for header logging comes with its own set of complexities:
- Complexity of HTTP Parsing in Kernel: Parsing arbitrary HTTP/1.1 (and especially HTTP/2 or HTTP/3) within the strict confines of an eBPF program can be challenging. It requires careful byte-level manipulation, handling variable-length fields, and adhering to verifier constraints (e.g., finite loops, bounded memory access). For HTTPS, parsing raw headers is impossible without decryption.
- Dealing with Encrypted Traffic (HTTPS): This is the single biggest challenge for network-level eBPF header logging. If
sock_filters or kprobes are used to intercept encrypted traffic, the HTTP headers will be unreadable. To access headers from HTTPS, you typically need to:- Use uprobes attached to the application or
api gatewayafter SSL/TLS decryption has occurred. This requires intimate knowledge of the target application's internal data structures. - Employ kernel-level TLS key logging (e.g., using
SSL_KEYLOGFILEfunctionality) in conjunction with network capture, which is complex and often impractical/insecure in production. - Leverage eBPF tools that can intercept
SSL_read/SSL_writefunctions to gain access to plaintext data, which is a more advanced technique.
- Use uprobes attached to the application or
- Handling Large Header Sets and Fragmentation: HTTP headers can be numerous and lengthy. Efficiently extracting and exporting them without exceeding eBPF map limits or introducing performance overhead requires careful design, often involving selective logging of only truly critical headers. Network packets can also be fragmented, requiring stateful tracking in eBPF maps to reconstruct complete headers.
- Exporting Data Efficiently: While
perf_bufferis efficient, high-volumeapitraffic can still generate a massive stream of header data. The user-space agent must be optimized to read, filter, process, and export this data to a logging backend (e.g., Elasticsearch, Loki, Splunk, Prometheus) without becoming a bottleneck itself. - Distinguishing Traffic for Specific API Gateway Instances or APIs: In environments with multiple
api gatewayinstances or numerous virtualapiendpoints, an eBPF program needs mechanisms to accurately tag or filter events based on the specificapiorapi gatewayinstance they pertain to. This might involve matchingHostheaders or correlating with process IDs. - Need for User-Space Agents: eBPF programs are small, kernel-resident. They do not persist data, format it into human-readable logs, or send it to remote logging systems. A user-space agent is always required to load the eBPF program, read data from eBPF maps, perform any necessary post-processing (e.g., redaction, enrichment, formatting), and then forward the logs to the final destination. This adds another component to manage and optimize.
Despite these challenges, the ability of eBPF to peer into the very fabric of network and application processing at such a low level, with minimal performance impact, represents a monumental leap forward for api and api gateway observability. The following section will elaborate on architectural patterns that can effectively harness eBPF's power, including how it complements broader api management platforms.
Architectural Patterns for eBPF-Powered Header Logging
Integrating eBPF for logging header elements effectively requires thoughtful architectural planning, considering the specific goals, existing infrastructure, and the nature of the api traffic. There are several patterns, each with its own trade-offs, depending on whether you prioritize raw network visibility, application-level context, or a hybrid approach. These patterns illustrate how eBPF can augment or even revolutionize traditional logging strategies, particularly for api and api gateway environments.
Scenario 1: Network-level HTTP Header Capture
This pattern focuses on intercepting HTTP headers directly from the network interface, providing a transparent and application-agnostic view of all api traffic.
Mechanism: 1. eBPF Program Attachment: An eBPF program is typically attached to a network interface using a sock_filter or via kprobes on kernel functions that handle incoming (tcp_recvmsg) and outgoing (tcp_sendmsg) network packets. This allows the eBPF program to inspect raw packet buffers. 2. HTTP Parsing in Kernel: The eBPF program contains logic to parse the TCP/IP and HTTP headers from the raw packet data. This involves identifying the start of the HTTP message, extracting the request/status line, and then iterating through the Header-Name: Header-Value pairs. 3. Data Extraction and Filtering: Based on configured rules, the eBPF program extracts specific headers (e.g., Host, X-Request-ID, User-Agent) or logs details about header presence/absence. It then creates a structured event containing this information (and possibly other metadata like source/destination IP, port, timestamp). 4. Data Export: These events are submitted to a perf_event_array (a ring buffer) in the kernel, which acts as a conduit to user space. 5. User-Space Agent: A user-space daemon or application (written in Go, Python, C, Rust) runs alongside the eBPF program. It continuously reads events from the perf_event_array. 6. Processing and Logging: The user-space agent processes the received events: * Performs any necessary post-processing, such as human-readable formatting. * Applies additional filtering or redaction rules (e.g., masking sensitive values in Authorization headers before sending to a log sink). * Enriches the data with additional context (e.g., host metadata). * Forwards the structured log events to a centralized logging backend (e.g., Loki, Elasticsearch, Splunk, Kafka).
Pros: * Complete Network Visibility: Captures all api traffic at the network layer, including requests that might be dropped by an api gateway or application due to low-level issues. * Application Agnostic: Works for any api endpoint or api gateway without requiring any changes to their code or configuration. * Minimal Overhead (relative to tcpdump): Significantly more efficient than traditional full packet capture for continuous monitoring.
Cons: * HTTPS Decryption Challenge: The most significant limitation. For encrypted HTTPS traffic, this approach generally cannot see the plaintext HTTP headers without complex and often insecure key logging techniques. * Complex In-Kernel Parsing: Writing robust and safe HTTP parsing logic within the eBPF program is challenging due to verifier constraints and the need to handle various HTTP nuances.
Scenario 2: User-space API Gateway/Application Integration (Uprobes)
This pattern targets specific functions within user-space applications, such as an api gateway or web server, allowing access to headers after they have been parsed and (for HTTPS) decrypted.
Mechanism: 1. Identify Target Functions: This requires knowledge of the target application's (e.g., Nginx, Envoy, specific api gateway implementation) internal codebase. Key functions to target would be those responsible for receiving, parsing, or storing HTTP request/response headers (e.g., ngx_http_read_request_header in Nginx, or similar functions in other gateways that handle api calls). 2. eBPF Program Attachment: Uprobes are attached to the entry or exit points of these identified functions within the api gateway process. 3. Accessing Application Data Structures: The eBPF program, upon activation, can access the memory of the user-space process. It needs to know the memory layout of the application's internal data structures (e.g., a struct representing an HTTP request) to read the parsed header values directly. This usually involves defining a struct in the eBPF C code that mirrors the application's internal structure. 4. Data Extraction and Filtering: The eBPF program reads the relevant header fields from these in-memory structures. It can then filter or extract specific headers, similar to the network-level approach. 5. Data Export: Extracted header data is submitted to a perf_event_array. 6. User-Space Agent: Similar to Scenario 1, a user-space agent reads from the perf_event_array, processes the events, and sends them to the logging backend.
Pros: * HTTPS Support: Since the uprobes attach after the api gateway has decrypted HTTPS traffic, this method provides plaintext access to headers for secure connections, which is critical for most apis. * Access to Structured Data: The api gateway has already done the heavy lifting of parsing HTTP. The eBPF program directly accesses structured header information, simplifying its logic. * Application Context: Potentially provides access to internal application context or derived data alongside headers, if the target function makes it available.
Cons: * Requires Application-Specific Knowledge: Identifying and understanding the internal functions and data structures of a specific api gateway or application can be challenging and requires deep insight into its source code. * Fragile to Application Updates: If the api gateway or application's internal structure changes in an update, the uprobe-based eBPF program might break or read incorrect memory locations, requiring updates to the eBPF program. * Less Transparent: Limited to specific processes and functions, making it less comprehensive than raw network capture for overall system visibility.
Scenario 3: Hybrid Approach
A robust observability strategy often combines elements of both network-level and user-space tracing to gain the best of both worlds.
Mechanism: * Deploy network-level eBPF for general traffic visibility, identifying non-HTTPS connections, and detecting early network-related issues or suspicious activity. * Simultaneously deploy uprobe-based eBPF on critical api gateway instances or backend services to capture decrypted HTTPS headers and gain deeper application-specific context for api interactions. * Correlate data from both sources using common identifiers (e.g., source IP/port, X-Request-ID if it can be inferred) in the user-space agent or downstream logging system.
Pros: * Comprehensive Visibility: Combines the transparency of network capture with the depth of application-level insight, including decrypted headers for HTTPS api traffic. * Redundancy and Cross-Validation: Allows for cross-checking data from different layers, enhancing the reliability of observability.
Cons: * Increased Complexity: Managing and correlating data from two distinct eBPF deployment patterns adds operational complexity. * Higher Resource Usage: Potentially consumes more kernel and user-space resources due to running multiple eBPF programs and agents.
APIPark Integration Point
No matter which eBPF architectural pattern is chosen, the raw, granular data collected by eBPF programs needs to be processed, stored, and presented in a meaningful way. This is where comprehensive api management platforms become invaluable. While eBPF provides kernel-level visibility and a "microscope" into the minutiae of network and process events, platforms like APIPark offer the consolidated, user-friendly view essential for overall api lifecycle management.
APIPark provides detailed API call logging, recording every detail of each api call that passes through its api gateway. This includes crucial information like request/response headers, which can be enriched by the kind of low-level data eBPF provides. Imagine eBPF capturing subtle network anomalies or identifying malformed header attempts at the kernel level, and then feeding this information into APIPark's logging system. APIPark can then integrate this deep eBPF insight with its existing comprehensive log data, performance analytics, and api security features, offering a holistic view for developers and operations teams. This powerful combination ensures system stability and data security from an api gateway perspective by:
- Enriching APIPark Logs: eBPF can augment APIPark's existing
apicall logs with kernel-level performance metrics or security observations that might not be visible at the application orgatewaylayer alone. - Proactive Issue Detection: eBPF could detect suspicious header patterns or anomalies before they even fully engage the
api gateway's processing logic, triggering alerts within APIPark's monitoring framework. - Deep Troubleshooting: When an
apiissue is identified in APIPark's dashboards, the underlying eBPF data can provide the extremely granular detail needed for deep-dive troubleshooting, revealing kernel-level interactions or specific header values that led to the problem.
This synergy allows enterprises to gain unparalleled insight into their api landscape, leveraging the raw power of eBPF for deep introspection while benefiting from APIPark's advanced api management, security, and analysis capabilities for a unified operational view.
Building an eBPF Header Logger: A Conceptual Walkthrough
Constructing an eBPF-powered header logger involves a coordinated effort between kernel-resident eBPF programs and user-space agents. This conceptual walkthrough outlines the fundamental steps, highlighting the tools and considerations necessary to bring such a system to life. We will focus on the general principles, acknowledging that specific implementations will vary based on the target api gateway, desired level of detail, and chosen programming languages.
Step 1: Identify Your Target and Define Your Goal
Before writing any code, it's crucial to define what specific header information you need and from where.
- Network-level (Scenario 1): Do you need to see all
apitraffic, including non-HTTPS, or traffic before it even reaches yourapi gateway? Then, targeting a network interface (eth0,lo) is appropriate. Your goal might be to detect specific header patterns, measure network-level latency, or captureX-Request-IDearly. - User-space (Scenario 2): Are you primarily concerned with decrypted HTTPS traffic passing through a specific
api gateway(e.g., Nginx, Envoy)? Then, targeting functions within thatapi gatewayprocess via uprobes is the way to go. Your goal might be to logAuthorizationheaders (redacted),Content-Typefor specificapis, or internalapi gatewayrouting headers.
For this walkthrough, let's consider a hybrid goal: to log critical HTTP headers (e.g., Host, User-Agent, X-Request-ID) for api requests, with a focus on capturing them after the api gateway has processed them (implying HTTPS support).
Step 2: Write the eBPF C Code
The core logic resides in a small C program that is compiled into eBPF bytecode. This code will define the eBPF maps, the probe attachments, and the logic to extract header data.
Conceptual eBPF C Code Structure:
#include <vmlinux.h> // Include kernel definitions for data structures
#include <bpf/bpf_helpers.h> // eBPF helper functions
#include <bpf/bpf_tracing.h> // For kprobes/uprobes

// Define the structure for the event data we want to send to user space
struct http_header_event {
    __u64 timestamp_ns;
    __u32 pid;
    char host[64];
    char user_agent[128];
    char x_request_id[64];
    // Add more fields for other headers as needed
};

// Define a perf buffer map to send data from kernel to user space
// `events` is a pointer to the buffer from user space
struct {
    __uint(type, BPF_MAP_TYPE_PERF_EVENT_ARRAY);
    __uint(key_size, sizeof(__u32));
    __uint(value_size, sizeof(__u32));
} events SEC(".maps");

// Define a program to attach to a user-space function (e.g., in an API Gateway)
// For simplicity, let's imagine a fictional 'api_gateway_process_request' function
// This function would typically have access to parsed HTTP request structures.
// In a real scenario, you'd target a specific function within Nginx, Envoy, etc.
SEC("uprobe/api_gateway_process_request")
int BPF_UPROBE(api_gateway_process_request, struct http_request_t *req)
{
    // Ensure the pointer 'req' is valid and accessible from the eBPF program
    // The BPF verifier will perform bounds checking.
    // 'req' here would be a pointer to the API Gateway's internal HTTP request object.

    struct http_header_event event = {};
    event.timestamp_ns = bpf_ktime_get_ns();
    event.pid = bpf_get_current_pid_tgid() >> 32; // Get PID

    // Example: Reading 'Host' header from 'req->headers.host' (conceptual)
    // Real-world: You'd need to know the exact struct layout and field offsets.
    bpf_probe_read_user(&event.host, sizeof(event.host), req->headers.host);
    bpf_probe_read_user(&event.user_agent, sizeof(event.user_agent), req->headers.user_agent);
    bpf_probe_read_user(&event.x_request_id, sizeof(event.x_request_id), req->headers.x_request_id);

    // Submit the event to the perf buffer
    bpf_perf_event_output(ctx, &events, BPF_F_CURRENT_CPU, &event, sizeof(event));

    return 0;
}

char LICENSE[] SEC("license") = "GPL";
Key Elements: * vmlinux.h and bpf_helpers.h: Provide necessary kernel type definitions and eBPF helper functions (e.g., bpf_ktime_get_ns, bpf_perf_event_output, bpf_probe_read_user). * http_header_event struct: Defines the data structure for the event that will be sent from the kernel to the user-space agent. This should be carefully designed to contain all necessary header information. * events map: Declares a BPF_MAP_TYPE_PERF_EVENT_ARRAY map, which is a common and efficient way for eBPF programs to send data to user space. * BPF_UPROBE macro: Attaches the function api_gateway_process_request to a user-space function. The arguments to BPF_UPROBE specify the function being probed and its expected arguments. * bpf_probe_read_user(): This crucial helper function safely reads data from user-space memory into the eBPF program's stack. It's essential for accessing application data structures. * bpf_perf_event_output(): Submits the http_header_event to the events perf buffer, making it available for the user-space agent.
Step 3: Write the User-space Go/Python Code
The user-space agent is responsible for loading the eBPF program, attaching the probes, reading data from the eBPF map, and then processing/exporting it. Tools like libbpf-go (for Go), BCC (for Python), or bpftool with custom C/Rust glue are commonly used.
Conceptual Python User-space Agent (using BCC for simplicity):
from bcc import BPF
import ctypes
import json
import datetime
import os

# Define the same event structure as in the eBPF C code
# (Need to match byte alignment and field types carefully)
class HttpHeaderEvent(ctypes.Structure):
    _fields_ = [
        ("timestamp_ns", ctypes.c_ulonglong),
        ("pid", ctypes.c_uint),
        ("host", ctypes.c_char * 64),
        ("user_agent", ctypes.c_char * 128),
        ("x_request_id", ctypes.c_char * 64),
    ]

# Path to the API Gateway executable (e.g., Nginx)
API_GATEWAY_EXEC = "/techblog/en/usr/sbin/nginx"
# Target function within the API Gateway
TARGET_FUNCTION = "ngx_http_read_request_header" # A hypothetical function for example

# 1. Compile and load the eBPF program
# For BCC, you'd typically embed the C code as a string or load from a file.
# For libbpf, you'd compile it with clang into an object file (.o) first.
bpf_text = """
// ... (Your eBPF C code from Step 2 goes here) ...
"""

# If using BCC, load the eBPF program
# b = BPF(text=bpf_text) # For BCC to compile from string

# If using libbpf, load from pre-compiled object file
# b = BPF(src_file="header_logger.bpf.c") # This is more common with libbpf-go/rust

# For demonstration with BCC, let's assume the C code is in a file
b = BPF(src_file="header_logger.c")

# 2. Attach the uprobe
# For BCC, use `attach_uprobe`
# For libbpf-go, you'd use `bpf.AttachUprobe` after loading the program
# You need to find the actual offset for the function in the target binary
# and the function name might be mangled. bpftool can help.
try:
    # Example: Attaching to a hypothetical Nginx function.
    # In reality, this requires knowing the symbol name and sometimes offset.
    # b.attach_uprobe(name=API_GATEWAY_EXEC, sym="ngx_http_read_request_header", fn_name="api_gateway_process_request")

    # For simplicity of this conceptual example, let's assume the Uprobe
    # from the C code is already attached based on its SEC() definition and
    # the user-space program just needs to open the map.
    print(f"eBPF program loaded and uprobe attached (conceptually) to {API_GATEWAY_EXEC}:{TARGET_FUNCTION}")

except Exception as e:
    print(f"Failed to attach uprobe: {e}")
    # Fallback or exit if essential probes cannot be attached.

# 3. Define a callback function to process events from the perf buffer
def print_event(cpu, data, size):
    event = ctypes.cast(data, ctypes.POINTER(HttpHeaderEvent)).contents

    timestamp_ms = event.timestamp_ns / 1_000_000 # Convert nanoseconds to milliseconds
    dt_object = datetime.datetime.fromtimestamp(timestamp_ms / 1000)

    log_entry = {
        "timestamp": dt_object.isoformat(sep='T', timespec='milliseconds'),
        "pid": event.pid,
        "host": event.host.decode('utf-8', 'ignore').strip(),
        "user_agent": event.user_agent.decode('utf-8', 'ignore').strip(),
        "x_request_id": event.x_request_id.decode('utf-8', 'ignore').strip(),
    }

    # Log to console, or send to a logging system (Loki, Elasticsearch, Kafka)
    print(json.dumps(log_entry))

# 4. Open the perf buffer and start consuming events
b["events"].open_perf_buffer(print_event)

print("Listening for API Gateway header events... Press Ctrl-C to stop.")
while True:
    try:
        b.perf_buffer_poll()
    except KeyboardInterrupt:
        break
    except Exception as e:
        print(f"Error polling perf buffer: {e}")
        break

print("Stopped.")
Key Elements: * Matching Structs: The user-space HttpHeaderEvent struct (e.g., using ctypes in Python) must exactly match the layout of the http_header_event struct defined in the eBPF C code. Mismatches will lead to corrupted data. * Loading eBPF Program: The agent loads the compiled eBPF bytecode into the kernel. * Attaching Probes: It programmatically attaches the uprobe to the target function within the specified executable. This often requires knowing the exact symbol name (which can be obtained using tools like readelf -Ws <binary>). * open_perf_buffer(): Opens the eBPF perf buffer map for reading. * Callback Function: Defines a function (print_event) that will be called by the eBPF framework whenever an event is submitted by the kernel eBPF program. This function deserializes the event data. * Data Processing and Export: The callback function is where data formatting, filtering (e.g., redacting sensitive Authorization token values), enrichment, and forwarding to a logging backend happen. Logging to JSON is often preferred for structured logging systems.
Example Table: Key HTTP Headers and Their eBPF Logging Relevance
This table illustrates some critical HTTP headers and how eBPF can provide valuable insights for api and api gateway operations.
| Header Name | Typical Use Case | eBPF Logging Relevance | Potential eBPF Attachment Point |
|---|---|---|---|
Authorization |
Client authentication (Bearer, Basic) | Detecting unauthorized access attempts, auditing security policy enforcement, rate limiting, token expiration monitoring (via presence/type, not value). | Network layer, api gateway uprobe |
Content-Type |
Media type of request/response body | Validating request format, identifying parsing errors, optimizing content negotiation for api. |
Network layer, api gateway uprobe |
User-Agent |
Client application/browser identification | Client profiling, bot detection, compatibility issues, understanding api consumer landscape. |
Network layer, api gateway uprobe |
X-Request-ID |
Unique request identifier for tracing | Crucial for distributed tracing, correlating logs across microservices and api gateway components. |
Network layer, api gateway uprobe |
X-Forwarded-For |
Original client IP in proxied requests | Accurate client IP logging, geo-blocking, abuse detection for api. |
Network layer, api gateway uprobe |
Cache-Control |
Caching directives for clients/proxies | Monitoring caching effectiveness, identifying stale caches, ensuring api performance. |
Network layer, api gateway uprobe |
Set-Cookie |
Server sends cookies to client | Session management auditing, security monitoring (e.g., Secure, HttpOnly flags), api session integrity. |
Network layer, api gateway uprobe |
Host |
Domain name of the server | Virtual host routing verification, identifying api endpoint access patterns. |
Network layer, api gateway uprobe |
Accept |
Client's preferred media types | Content negotiation monitoring, ensuring api serves appropriate response formats. |
Network layer, api gateway uprobe |
Tools and Frameworks
- BCC (BPF Compiler Collection): A toolkit for creating eBPF programs, primarily in Python. It simplifies the development workflow by handling compilation, loading, and map interaction. Excellent for rapid prototyping.
- libbpf / bpftool: The official eBPF library and command-line tool.
libbpfprovides a stable C API for eBPF, making it suitable for production-grade applications.bpftoolis invaluable for inspecting eBPF programs, maps, and events. libbpf-go: A Go wrapper aroundlibbpf, offering a robust way to write eBPF user-space agents in Go.- Cilium/Tetragon: Projects that heavily leverage eBPF for networking, security, and runtime visibility in Kubernetes and cloud-native environments. They provide higher-level abstractions over raw eBPF.
- Falco: An open-source runtime security project that uses eBPF to detect anomalous activity in containerized applications. It can be adapted for security-focused header monitoring.
Deployment Considerations
- Kernel Version: eBPF capabilities vary across kernel versions. Modern kernels (5.x and above) offer the richest features. Ensure your target systems run compatible kernels.
- Security Policies: eBPF programs run in the kernel. Proper security considerations, including limiting who can load eBPF programs (
CAP_BPForCAP_SYS_ADMIN), are paramount. - Resource Management: While low-overhead, poorly written eBPF programs can still consume CPU or memory. Monitor their resource usage carefully in production.
- Data Export and Visualization: The user-space agent should integrate seamlessly with your existing logging and monitoring stack. This means exporting data in a structured format (JSON, protobuf) that can be ingested by tools like Prometheus, Grafana, ELK stack (Elasticsearch, Logstash, Kibana), or Loki for dashboarding, alerting, and long-term analysis.
By meticulously following these steps and leveraging the appropriate tools, organizations can build powerful eBPF-powered header loggers that provide unprecedented visibility into their api traffic and api gateway operations. This granular insight, collected with minimal overhead, empowers teams to diagnose issues faster, enhance security posture, and optimize performance in ways previously unattainable with traditional logging methods.
Conclusion
The evolution of distributed systems, characterized by dynamic microservices and sophisticated api gateway architectures, has dramatically amplified the need for deep, high-fidelity observability. Traditional logging mechanisms, while foundational, often present a compromise between invasiveness, performance overhead, and the granularity of information, especially when it comes to the critical metadata embedded within HTTP headers. These headers, the silent orchestrators of api communication, dictate everything from authentication and caching to routing and tracing, making their comprehensive logging indispensable for the health and security of modern services.
This deep dive has illuminated eBPF as a transformative technology, fundamentally altering the landscape of system observability. By enabling sandboxed programs to execute directly within the Linux kernel, eBPF offers an unparalleled vantage point into network traffic and application internals without the need for application code modification or the significant overhead of full packet capture. We've explored how eBPF's inherent benefits—low overhead, exceptional granularity, kernel safety, and non-invasiveness—make it an ideal candidate for logging header elements in high-throughput api and api gateway environments.
We delved into practical approaches, contrasting network-level capture with user-space uprobe integration, each offering distinct advantages for observing encrypted HTTPS traffic or gaining raw packet insights. The conceptual walkthrough provided a roadmap for constructing an eBPF-powered logger, emphasizing the symbiotic relationship between kernel-resident eBPF programs and user-space agents that process and export the rich data. Furthermore, we highlighted how such granular eBPF insights can complement and enrich comprehensive api management platforms like APIPark, offering a unified and powerful solution for end-to-end api governance, security, and performance.
The future of api observability is intrinsically linked with technologies like eBPF. As api infrastructures grow in complexity, the ability to peer into the kernel's processing of every request, to capture vital header elements with precision and efficiency, becomes not just an advantage but a necessity. Empowering developers and operators with this unprecedented visibility leads to faster incident response, enhanced security postures against evolving threats, and ultimately, more resilient and performant systems that can confidently scale to meet the demands of the modern digital world. The journey into eBPF for logging header elements is a testament to the continuous innovation driving us towards a future of truly observable and manageable api ecosystems.
Frequently Asked Questions (FAQ)
1. What are the main limitations of traditional logging for HTTP headers in api environments? Traditional methods like application-level logging require code changes, are language-dependent, and have blind spots (e.g., issues before the application layer). Proxy/api gateway logging offers centralization but lacks internal application context and can be limited by vendor features. Raw network packet capture (e.g., tcpdump) provides ultimate granularity but incurs extremely high overhead, struggles with HTTPS decryption, and is unsuitable for continuous production monitoring.
2. How does eBPF overcome these limitations for api header logging? eBPF programs run directly in the Linux kernel with minimal overhead, offering granular access to network packets and kernel/user-space function calls without modifying application or api gateway code. This enables non-invasive, high-performance capture of header elements, even after HTTPS decryption (via uprobes), providing deep insights into api traffic previously unavailable or too costly to obtain.
3. Can eBPF decrypt HTTPS traffic to log headers? No, eBPF itself does not decrypt HTTPS traffic at the network layer. To log plaintext HTTP headers from HTTPS connections using eBPF, you typically need to employ uprobes. These uprobes attach to functions within the user-space api gateway or web server (e.g., Nginx, Envoy) after the application has already performed SSL/TLS decryption, allowing eBPF to access the unencrypted header data from the application's memory.
4. What are the primary attachment points for eBPF programs to log api headers? There are two main categories: * Network Layer: Using sock_filter or kprobes on kernel functions (e.g., tcp_recvmsg) to inspect raw network packets. This provides transparent visibility but cannot decrypt HTTPS. * Application/API Gateway Layer: Using uprobes attached to specific functions within an api gateway process (e.g., Nginx's HTTP parsing functions). This allows access to decrypted headers and application-specific context but requires knowledge of the api gateway's internal structure.
5. How does a platform like APIPark complement eBPF-powered header logging? While eBPF provides raw, kernel-level detailed insights into header elements, api management platforms like APIPark offer a consolidated, user-friendly interface for managing, monitoring, and analyzing api traffic. APIPark's detailed API call logging capabilities can be enriched by eBPF-collected data, integrating low-level performance metrics, security observations, or specific header insights into its broader api lifecycle management, analytics, and security features. This synergy provides a holistic view, enabling faster troubleshooting, enhanced security, and optimized performance for apis.
🚀You can securely and efficiently call the OpenAI API on APIPark in just two steps:
Step 1: Deploy the APIPark AI gateway in 5 minutes.
APIPark is developed based on Golang, offering strong product performance and low development and maintenance costs. You can deploy APIPark with a single command line.
curl -sSO https://download.apipark.com/install/quick-start.sh; bash quick-start.sh

In my experience, you can see the successful deployment interface within 5 to 10 minutes. Then, you can log in to APIPark using your account.

Step 2: Call the OpenAI API.