Dynamic Log Viewer: Real-Time Insights for Smarter Debugging
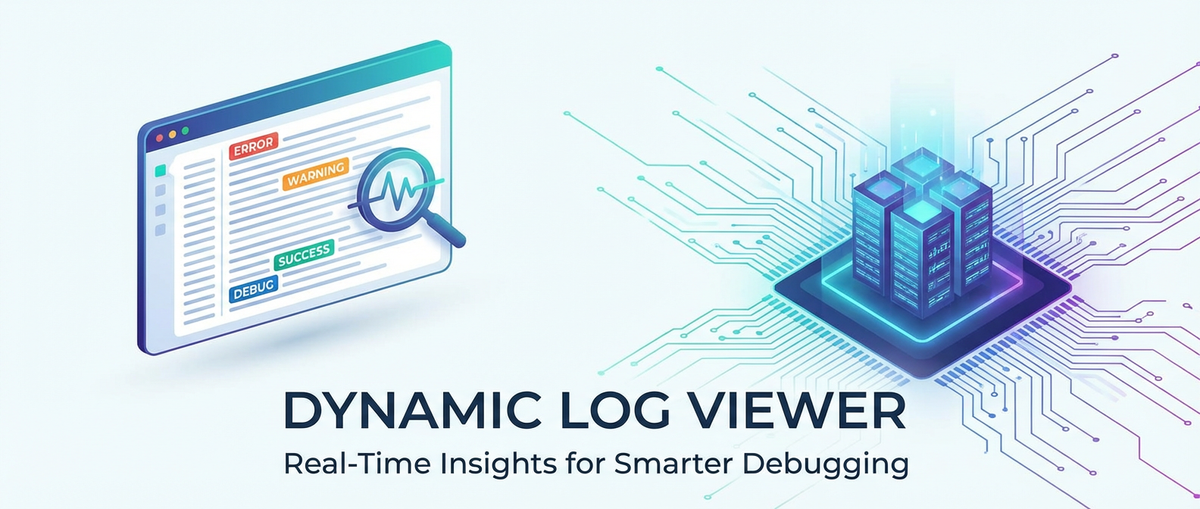


In the intricate tapestry of modern software development and operations, logs serve as the digital breadcrumbs that tell the story of an application's life. From the moment a service springs into existence to its every interaction, every error, and every triumph, logs meticulously record the underlying narrative. They are the eyes and ears of developers, the diagnostic tools of operations engineers, and often, the last resort for uncovering elusive bugs or performance bottlenecks in complex systems. Yet, for all their undeniable importance, the sheer volume and distributed nature of logs in contemporary architectures, especially those heavily reliant on api interactions and api gateway services, can transform this invaluable resource into an overwhelming deluge of data. Traditional log viewing methods, often static, disconnected, and requiring extensive manual parsing, are no longer sufficient to navigate this flood. They present a fragmented picture, lagging behind the real-time demands of agile development and high-availability operations, rendering true "smarter debugging" an aspirational goal rather than a daily reality.
This article delves deep into the transformative power of dynamic log viewers – sophisticated tools designed not merely to display log entries, but to enable interactive, real-time exploration and analysis of this critical data stream. We will explore how these innovative platforms bridge the gap between raw log data and actionable insights, empowering development and operations teams to identify, diagnose, and resolve issues with unprecedented speed and precision. By moving beyond passive observation to active engagement with log flows, dynamic log viewers become indispensable allies in the quest for system resilience, operational efficiency, and a profound understanding of application behavior. They are not just tools for problem-solving; they are catalysts for proactive monitoring, predictive maintenance, and ultimately, the cultivation of robust, intelligent software ecosystems capable of self-correction and continuous improvement. As we navigate the complexities of distributed systems, microservices, and event-driven architectures, the ability to harness real-time log insights is no longer a luxury but a fundamental requirement for maintaining competitive edge and ensuring seamless user experiences.
The Evolution of Logging and Debugging: From Simple Prints to Distributed Complexity
The journey of logging in software development mirrors the evolution of software itself, from simplistic standalone programs to today's hyper-connected, globally distributed systems. In the nascent days of programming, debugging was often an intimate affair. Developers would insert print statements directly into their code, outputting variable states or execution paths to the console. These rudimentary logs were ephemeral, often discarded after a successful run, and served primarily for local, immediate problem identification. The log file, a plain text document appending entries over time, represented the first significant step towards persistent logging. It allowed for post-mortem analysis and a slightly broader view of an application's historical behavior, though still largely confined to a single machine and a single process. Debugging was a reactive process, heavily reliant on reproducing the issue or painstakingly sifting through static files line by line, a process that could be agonizingly slow and prone to human error.
As applications grew in complexity, transitioning from monolithic architectures to client-server models and eventually to the distributed microservices landscape prevalent today, the challenges of logging escalated exponentially. A monolithic application might generate logs from a few well-defined components within a single process, making it relatively straightforward to correlate events. However, the advent of microservices fragmented this elegant simplicity. An operation that once occurred within a single process now spans multiple independent services, each deployed on its own infrastructure, communicating asynchronously or through api calls. This distributed nature meant that a single user request could generate a cascade of log entries across dozens, if not hundreds, of distinct log files, residing on different servers, often in different geographical regions. Correlating these disparate entries to trace the lifecycle of a single request became a herculean task, often impossible without specialized tools and conventions like correlation IDs. The sheer volume of log data also exploded, rendering manual inspection an impractical and inefficient endeavor, paving the way for the necessity of more sophisticated log management solutions.
The initial response to this escalating complexity was the rise of centralized logging systems. Tools like the ELK stack (Elasticsearch, Logstash, Kibana), Splunk, and others emerged as critical infrastructure components, designed to aggregate logs from all corners of a distributed system into a single, searchable repository. These platforms provided significant improvements: a unified view of all logs, powerful indexing for fast searching, and visualization dashboards for trend analysis. Developers and operations teams could finally search across all logs simultaneously, filter by host, service, or severity, and even build custom dashboards to monitor system health. This centralization was a game-changer, transforming log management from a fragmented, manual process into a structured, searchable, and somewhat automated one. However, even with these advancements, a critical gap persisted: while centralized systems excelled at storing and searching historical log data, they often fell short in providing true dynamic, real-time interaction with the live stream of logs. The insights gleaned were often retrospective, analyzing what had happened, rather than actively observing what was happening in the present moment, leaving a crucial void for real-time debugging and proactive problem identification. This unmet need laid the groundwork for the emergence of dynamic log viewers, designed to inject interactivity and immediacy into the log analysis process, making them an indispensable component of any modern observability stack.
What is a Dynamic Log Viewer? Deciphering the Interactive Log Stream
At its core, a dynamic log viewer is far more than a simple program designed to open and display text files. It represents a paradigm shift in how developers and operations engineers interact with the relentless torrent of information generated by their applications. Unlike its static predecessors, which merely present a snapshot of logs at a given moment, a dynamic log viewer offers a live, interactive window into the soul of a running system. Imagine watching a river flow, not as a series of still photographs taken at intervals, but as a continuous, surging current that you can manipulate, filter, and analyze in real-time. That, in essence, is the power of a dynamic log viewer. It transforms passive observation into active engagement, enabling immediate insight into an application's behavior as it unfolds.
The fundamental characteristic that sets a dynamic log viewer apart is its ability to provide a real-time tail or stream of log entries. This means that as new logs are generated by applications, services, or the underlying infrastructure – be it a new user request hitting an api, a database query executing, or an error bubbling up through an api gateway – they are instantly displayed in the viewer, often within milliseconds of their creation. This immediate feedback loop is invaluable for debugging, allowing engineers to trigger an action, observe its corresponding log output, and identify anomalies without delay. But real-time tailing is just the beginning. The true intelligence of these tools lies in their sophisticated feature set, designed to make sense of the overwhelming volume of data.
Key characteristics and capabilities of a dynamic log viewer include:
- Real-time Tail/Streaming: This is the bedrock feature, continuously updating the display with the latest log entries as they are generated. It provides an immediate pulse on the system's activity, crucial for live troubleshooting and monitoring.
- Advanced Filtering: Raw log streams are often too noisy to be useful without intelligent filtering. Dynamic log viewers offer powerful filtering mechanisms, allowing users to narrow down the displayed logs based on various criteria. This can include keywords (e.g., "error", "warning"), regular expressions for complex pattern matching, specific log levels (e.g., DEBUG, INFO, ERROR), time ranges (e.g., last 5 minutes), and even structured log fields (e.g.,
user_id,request_id,service_name). This granular control enables engineers to quickly hone in on relevant events amidst a sea of information. - Search Capabilities: Beyond simple filtering, robust search functionalities allow users to query historical and live log data with speed and precision. Whether searching for a specific transaction ID, an
apiendpoint, or a particular error code, the ability to rapidly retrieve relevant logs is paramount for efficient debugging and root cause analysis. - Highlighting: To draw immediate attention to critical information, dynamic log viewers often feature customizable highlighting. Users can define rules to visually emphasize log entries containing specific keywords (e.g., "authentication failed"), error codes, or even particular user IDs. This visual cue significantly reduces the cognitive load of scanning vast amounts of text, directing focus to areas of concern.
- Contextualization: Modern applications are distributed, and a single issue might manifest across multiple services. Dynamic log viewers can offer features to contextualize log entries, linking related logs together. This often involves using correlation IDs (also known as trace IDs or request IDs) that are propagated across service boundaries for a single operation. By clicking on a log entry, users can instantly view all related logs pertaining to that specific transaction, providing a holistic view of the event's journey through the system.
- Persistence vs. Ephemeral Views: While real-time views are critical, the ability to save specific filtered views or search queries allows teams to quickly revisit recurring issues or share diagnostic perspectives. Some viewers also maintain a buffer of recent logs, enabling a quick look back without needing to re-fetch from storage.
- User Interface/Experience (UI/UX): A well-designed UI is paramount for usability. Dynamic log viewers typically feature intuitive interfaces with controls for filtering, searching, pausing/resuming the stream, and navigating through log history. Color-coding, expandable details, and clear timestamps enhance readability and reduce mental fatigue.
- Integration with Other Tools: The most powerful dynamic log viewers do not exist in isolation. They integrate seamlessly with other tools in the observability stack, such as Application Performance Monitoring (APM) systems, CI/CD pipelines, and alerting platforms. This integration allows for a more holistic view of system health, connecting log events with metrics, traces, and deployment activities. For instance, an alert from an APM tool could automatically open a dynamic log viewer filtered to the relevant service and time window.
Crucially, in environments where api calls are the lifeblood of communication and an api gateway acts as the central traffic cop, dynamic log viewers become even more indispensable. Platforms like APIPark, an open-source AI gateway and API management platform, provide comprehensive logging capabilities, meticulously recording every detail of each API call, from request headers to response bodies, and the processing logic within the gateway itself. A dynamic log viewer then empowers developers and operations teams to interact with these granular logs in real-time. It transforms raw log data, generated by systems like APIPark, into actionable insights for rapid issue identification and resolution. Imagine an api call failing due to an upstream service error; a dynamic log viewer, interacting with APIPark's detailed logs, would instantly highlight the error message, the specific api endpoint, and the correlation ID, allowing an engineer to dive deep into the problem as it happens, turning potential downtime into a fleeting glitch. This fusion of comprehensive log generation with dynamic, interactive viewing capabilities represents a significant leap forward in debugging efficiency and system understanding.
Why Dynamic Log Viewers are Crucial for Real-Time Insights
In today's fast-paced digital landscape, where minutes of downtime can translate into significant financial losses and irreparable damage to reputation, the ability to gain real-time insights into system behavior is not just an advantage—it is a fundamental necessity. Dynamic log viewers are the linchpin in achieving this immediacy, offering a level of transparency and responsiveness that traditional logging methods simply cannot match. Their real-time capabilities are not merely a convenience; they are critical enablers for a host of operational and developmental imperatives, transforming how teams react to, understand, and ultimately prevent system issues.
Immediate Problem Identification
The most immediate and obvious benefit of a dynamic log viewer is its power to identify problems as they happen. Rather than waiting for an alert system to trigger after an issue has escalated, or manually sifting through log files hours after a customer complaint, engineers can actively monitor the log stream. Imagine an api gateway suddenly experiencing a surge in 5xx errors; a dynamic log viewer would instantly highlight these errors in the live stream, along with contextual information such as the affected api endpoints, client IPs, and internal service responses. This proactive identification allows for intervention at the earliest possible stage, often before the issue impacts a significant number of users or cascades into a more severe outage. The ability to spot anomalies—be it an unexpected log level appearing, a sudden flood of warnings, or a repeated error message—in real-time is invaluable for maintaining system stability and ensuring a smooth user experience. This rapid feedback loop dramatically shortens the Mean Time To Detect (MTTD) issues, which is a critical metric in incident response.
Performance Monitoring
Beyond just error detection, dynamic log viewers are powerful tools for real-time performance monitoring. Logs often contain valuable data points related to execution times, database query durations, api response latencies, and resource utilization. By filtering and observing these performance-related metrics in the live log stream, operations teams can spot bottlenecks as they emerge. For instance, a sudden increase in the duration of api calls to a particular backend service, logged by an api gateway, would be immediately visible. This allows engineers to investigate potential resource contention, inefficient code paths, or network latency issues before they degrade overall system performance. The visual cues and real-time aggregation capabilities of dynamic viewers make it easier to discern trends and spikes that might indicate an impending performance crisis, enabling proactive scaling or optimization efforts.
Security Auditing and Threat Detection
In an era of increasing cyber threats, security auditing is paramount. Dynamic log viewers provide a continuous feed of system activities, making them invaluable for real-time security monitoring. By filtering for specific keywords like "authentication failed," "unauthorized access," "SQL injection attempt," or "malicious request," security teams can detect suspicious activities as they occur. For example, a sudden flurry of failed login attempts against an api endpoint could indicate a brute-force attack, which would be immediately visible in a dynamic log viewer configured to highlight such events. The ability to quickly correlate these security-related log entries with source IPs, user agents, and timestamps allows for rapid response, potentially preventing data breaches or system compromises by blocking malicious actors in real-time. This level of immediacy is crucial for effective threat detection and incident response, providing a first line of defense against evolving cyber threats.
Behavioral Analysis and User Journey Tracking
Dynamic log viewers also offer profound insights into user behavior and application flow. By logging specific events throughout a user's journey—from initial login, through navigation, interactions with various features, and api calls—teams can gain a real-time understanding of how users interact with their application. If a user reports an issue, a dynamic log viewer can be quickly configured to display all logs related to that user_id or session_id, revealing their exact path through the system and any errors they encountered. This level of granular, real-time behavioral analysis helps in understanding user experience, identifying pain points in application flows, and debugging complex user-specific issues that might not manifest as general system errors. It moves debugging from an abstract code problem to a concrete user experience issue.
Root Cause Analysis and Reduced MTTR (Mean Time To Resolution)
Perhaps the most critical contribution of dynamic log viewers is their ability to dramatically accelerate root cause analysis. When an incident occurs, the race is on to understand why it happened and how to fix it. With a dynamic log viewer, engineers can immediately begin exploring the live log stream, applying filters, and correlating events across different services to pinpoint the origin of the problem. If a service becomes unresponsive, the viewer can reveal the last successful api calls, the subsequent error messages, and any cascading failures. The ability to interactively "rewind" or pause the stream, coupled with powerful search capabilities, allows for surgical precision in diagnosis. This rapid identification of the root cause directly translates to a significant reduction in Mean Time To Resolution (MTTR), minimizing the impact of incidents on users and businesses alike. Fast diagnosis means faster fixes, leading to higher system availability and greater user satisfaction.
Proactive Operations and Predictive Insights
Beyond reactive problem-solving, dynamic log viewers empower teams to move towards proactive operations. By regularly monitoring the live log stream, engineers can develop an intuitive understanding of "normal" system behavior. Any deviation from this baseline—a slight increase in warnings, an unexpected pattern of api calls, or unusual resource logs—can serve as an early warning sign of an impending issue. Coupled with advanced analytics, this real-time data can contribute to predictive maintenance, allowing teams to address potential problems before they escalate into full-blown outages. For example, consistently high latency for specific api calls, even if not yet causing errors, could indicate a need for horizontal scaling or database optimization. The continuous, dynamic stream of information facilitates a culture of continuous observation and anticipation, making systems more resilient and self-healing over time.
In summary, dynamic log viewers are not merely an upgrade; they are an essential evolutionary step in modern debugging and operations. They provide the immediate, contextual, and interactive insights necessary to thrive in complex, distributed environments, ensuring that the critical data contained within logs is leveraged to its fullest potential for immediate problem-solving, proactive monitoring, and continuous system improvement.
Smarter Debugging with Dynamic Log Viewers: Beyond Reactive Fixes
Traditional debugging often feels like detective work after the fact. An incident occurs, an alert fires, and then the laborious process of sifting through historical data begins. This reactive approach, while necessary, inherently puts teams on the back foot. Smarter debugging, enabled by dynamic log viewers, fundamentally shifts this paradigm, moving from a "fix after failure" mentality to one of "preventing failure" and "understanding continuously." It's about empowering engineers not just to react to symptoms but to understand the underlying mechanics of their systems in real-time, fostering a deeper, more proactive relationship with their applications.
Beyond Reactive Debugging: From Fixing to Preventing
The primary differentiator of smarter debugging is its proactive nature. Instead of just waiting for something to break, dynamic log viewers allow engineers to actively monitor system health and anticipate issues. Imagine a developer making a code change that inadvertently introduces a subtle bug affecting a specific api endpoint. Without a dynamic log viewer, this might only be discovered hours later through an error report or a customer complaint. With a dynamic log viewer, the developer can deploy their change, then immediately observe the live log stream for that particular service or api in a staging or production environment. Any unexpected warnings, errors, or performance degradation related to the new code would be instantly visible, allowing for rapid rollback or hotfix before it impacts end-users. This real-time validation drastically reduces the risk associated with deployments and fosters a continuous feedback loop that is critical for agile development cycles.
Structured Logging's Role in Enhancing Dynamic Viewing
The efficacy of a dynamic log viewer is amplified exponentially when coupled with structured logging. Instead of plain text messages, structured logs (e.g., JSON, key-value pairs) provide context-rich data where each piece of information is explicitly labeled. For example, instead of "Error processing request," a structured log might be {"level": "error", "message": "processing request failed", "request_id": "abc123", "api_endpoint": "/techblog/en/users", "status_code": 500}. This rich structure is a goldmine for dynamic log viewers. It enables:
- Field-based Filtering: Instead of just keyword searches, users can filter by
status_code: 500orapi_endpoint: /users, leading to much more precise queries. - Aggregations and Analytics: Dynamic viewers can quickly count errors by
api_endpointor calculate average latency byservice_name. - Better Contextualization: Correlation IDs (
request_id) are explicitly fields, making it trivial to group related logs across services. - Automated Parsing: The viewer doesn't need to guess; it knows exactly what each piece of data represents, leading to more reliable and powerful analysis.
Without structured logging, dynamic log viewers are still useful, but their full potential for smarter, field-aware debugging remains untapped.
Filtering Strategies: Practical Examples for Insight Generation
The true art of smarter debugging with dynamic log viewers lies in mastering filtering strategies. These are not merely about reducing noise but about extracting specific, actionable signals from the cacophony of data.
- Filtering by
apiEndpoint: If a specific feature is failing, and you know it interacts with/api/v1/payments, you can instantly filter the live stream to show only logs related to thatapiendpoint. This immediately isolates the problem space, showing only relevant requests and responses. - Filtering by
api gatewayErrors: When theapi gatewayreports a large number of 5xx errors, a dynamic log viewer can be filtered to show onlylevel: errorlogs originating from thegatewayitself. This helps differentiate between issues within the gateway (e.g., misconfigurations, resource exhaustion) and errors originating from upstream services. You can then quickly pivot to filter logs from the identified problematic backend service. - Correlation IDs for Distributed Tracing: In a microservices architecture, a single user action might touch a dozen different services. If each service logs a common
correlation_id(or trace ID), a dynamic log viewer can be configured to display all logs sharing that ID. This creates a complete "story" of the user's request across all services, making it effortless to pinpoint where a failure occurred or where latency was introduced. This is invaluable for understanding complex distributed transactions and debugging intermittent issues that span multiple components. - User-Specific Debugging: When a customer reports a unique issue, filtering by their
user_idorsession_idallows engineers to observe their specific interaction path and identify any errors or unusual behavior they encountered in real-time, providing immediate context for support.
Pattern Recognition and Anomaly Detection
Humans are excellent at pattern recognition, and dynamic log viewers enhance this capability. By observing the live log stream, engineers can quickly spot:
- Error Floods: A sudden, sustained burst of error messages, even if not immediately critical, signals an underlying issue that needs attention.
- Repetitive Warnings: Constant warnings about deprecated
apiusage or resource exhaustion can indicate a simmering problem that will eventually boil over. - Unusual Access Patterns: A dynamic viewer might highlight a series of
apicalls from an unfamiliar IP address or an unusual sequence of resource access, indicating potential security concerns.
Some advanced dynamic log viewers also incorporate rudimentary anomaly detection, using machine learning to flag deviations from established log patterns automatically. This further enhances proactive debugging by bringing subtle issues to the forefront.
Collaboration and Shared Context
Debugging is rarely a solo activity in complex environments. Dynamic log viewers facilitate collaboration by allowing engineers to share specific filtered views or search queries. If one engineer identifies a suspicious pattern, they can instantly share the exact view with a colleague, ensuring everyone is looking at the same real-time data. This shared context eliminates ambiguity and streamlines the collaborative debugging process, especially crucial during high-stakes incidents where multiple teams might be involved in resolving a problem spanning different domains (e.g., api gateway team, backend api team, database team).
Visualizations for Quick Understanding
While log lines are the raw truth, sometimes a picture is worth a thousand lines of log. Many dynamic log viewers integrate basic visualization capabilities, such as graphs or charts, to represent log data. This could be a timeline of error rates, a bar chart of api calls per endpoint, or a gauge of average api gateway latency. These visual aggregations provide a quick, high-level understanding of system health and highlight trends or anomalies that might be harder to spot in raw text, making "smarter debugging" not just about depth, but also about immediate clarity and intuitive comprehension.
In essence, smarter debugging with dynamic log viewers is about turning a reactive chore into a proactive superpower. By providing real-time, interactive, and contextualized access to the beating heart of an application, these tools transform developers and operations engineers from mere firefighters into system architects who understand, anticipate, and preemptively resolve issues, fostering robust and resilient software systems.
APIPark is a high-performance AI gateway that allows you to securely access the most comprehensive LLM APIs globally on the APIPark platform, including OpenAI, Anthropic, Mistral, Llama2, Google Gemini, and more.Try APIPark now! 👇👇👇
Key Features and Advanced Capabilities of Dynamic Log Viewers
The baseline functionality of a dynamic log viewer – real-time tailing and basic filtering – is incredibly powerful. However, the true value and sophistication of these tools become apparent when delving into their more advanced capabilities. These features transform a simple log display into a comprehensive diagnostic workbench, capable of handling the vast scale and complexity of modern distributed systems, especially those built upon extensive api ecosystems and controlled by robust api gateway solutions.
1. Live Tail/Streaming: The Heartbeat of Real-Time Operations
As discussed, the live tail is the foundational feature, providing a continuous, immediate stream of log entries. Advanced dynamic log viewers optimize this by:
- Efficient Data Ingestion: Handling millions of log lines per second without overwhelming the client or backend infrastructure.
- Intelligent Buffering: Temporarily storing logs to allow pausing, scrolling back, and resuming the live stream without missing entries.
- Auto-Scroll vs. Manual Scroll: Providing options to automatically scroll to the newest entries or to pause auto-scrolling when the user is inspecting older logs.
- Bandwidth Optimization: Techniques like compression or partial updates to ensure smooth performance even over limited network connections.
2. Powerful Search and Filtering: Precision in a Deluge
Beyond simple keyword searches, advanced filtering empowers users to perform highly granular queries:
- Regex Support: Allowing for complex pattern matching, invaluable for extracting specific data points from unstructured logs or identifying nuanced error patterns.
- Boolean Logic: Combining multiple conditions using AND, OR, NOT operators (e.g.,
error AND ("gateway" OR "service_a")). - Field-Based Queries (for Structured Logs): The ability to query specific fields like
level:error,api_endpoint:/users/login,correlation_id:abc-123. This is fundamental for modern structured logging. - Numerical and Range Queries: Filtering logs where
latency > 100msorhttp_status_code BETWEEN 400 AND 499. - Exclusion Filters: Filtering out known noisy log patterns to reduce clutter and focus on relevant information.
- Saved Queries and Views: Allowing users to save frequently used complex filters or customized views for quick access and sharing within teams.
3. Log Aggregation and Correlation: Connecting the Dots
In distributed systems, logs are scattered. Dynamic log viewers excel at bringing them together:
- Centralized Collection: Integrating with agents (e.g., Filebeat, Fluentd), syslog, or direct
apiingestion to collect logs from all sources (servers, containers, serverless functions,api gatewayinstances). - Correlation ID/Trace ID Linking: Automatically grouping all log entries that share a common correlation ID, providing an end-to-end view of a single request or transaction across multiple services. This is critical for debugging distributed microservice architectures, where an
apicall might traverse several components before completing. - Contextual Linking: Allowing users to jump from a log entry in one service to related logs in another service, even if they don't share an explicit correlation ID, often by inferring relationships based on timestamps or shared attributes.
4. Alerting and Notifications: Proactive Issue Detection
A dynamic log viewer isn't just for manual inspection; it can also act as an intelligent sentry:
- Threshold-Based Alerts: Triggering alerts when the rate of specific log messages (e.g.,
errorlogs, 4xx/5xxapi gatewayerrors) exceeds a predefined threshold within a time window. - Pattern-Based Alerts: Notifying teams when specific, critical log patterns (e.g., "database connection refused," "unauthorized access attempt") appear in the stream.
- Integration with Paging Systems: Sending alerts to Slack, PagerDuty, email, or other incident management tools, ensuring that the right teams are notified instantly when critical events occur.
- Custom Webhooks: Allowing for flexible integration with custom automation scripts or internal tools.
5. Historical Data Access: Looking Back with Context
While real-time is crucial, the ability to analyze past incidents is equally important:
- Time Range Selection: Easily navigating through vast archives of historical logs by specifying exact timeframes or relative periods (e.g., "yesterday," "last week").
- High-Speed Indexing: Leveraging powerful search engines (like Elasticsearch) to query petabytes of log data in seconds, essential for post-mortem analysis and compliance auditing.
- Archiving and Retention Policies: Managing the lifecycle of log data, moving older, less frequently accessed logs to cheaper storage while maintaining searchability, often with configurable retention periods to meet regulatory requirements.
6. Customizable Dashboards: Tailored Views for Every Role
Different roles require different perspectives on log data:
- Role-Based Dashboards: Allowing engineers, SREs, security analysts, and even business users to create dashboards tailored to their specific needs. An SRE might track
api gatewayhealth and error rates, while a security analyst might focus on authentication failures and suspicious access patterns. - Widgets and Visualizations: Populating dashboards with various widgets such as log tables, trend lines for error rates, bar charts for log levels, geo-maps for user origins, and performance metrics derived from logs (e.g.,
apicall latencies). - Drill-Down Capabilities: Enabling users to click on a chart element (e.g., a spike in errors) and immediately drill down into the underlying raw log entries for detailed investigation.
7. Integration Ecosystem: Part of a Larger Observability Puzzle
The most effective dynamic log viewers are part of a broader observability strategy:
- APM Integration: Linking log events to metrics and traces from APM tools, providing a unified view of application performance and health. If an APM tool detects a slow transaction, the dynamic log viewer can provide the granular log details behind that slowness.
- CI/CD Pipeline Integration: Showing log events tied to specific deployments, enabling rapid validation of new releases and quick identification of deployment-related issues.
- Incident Management Integration: Automatically creating or updating incidents in tools like Jira or ServiceNow based on critical log events.
- Infrastructure Monitoring: Correlating application logs with host, container, or network logs to identify underlying infrastructure issues impacting application performance.
8. Security and Access Control: Protecting Sensitive Information
Logs often contain sensitive data, making robust security crucial:
- Role-Based Access Control (RBAC): Defining who can view which logs, restricting access based on roles (e.g., developers see development logs, security team sees all security-related logs, but not all application details).
- Data Masking/Redaction: Automatically redacting sensitive information (e.g., credit card numbers, PII) from log entries before they are stored or displayed, ensuring compliance with data privacy regulations.
- Audit Trails: Logging all user actions within the dynamic log viewer itself, providing a record of who accessed what log data and when.
- SSO/LDAP Integration: Seamlessly integrating with existing enterprise authentication systems.
9. Scalability: Handling Vast Volumes of Log Data
Modern applications generate enormous volumes of logs, requiring robust infrastructure:
- Distributed Architecture: Built on scalable backend technologies (like Elasticsearch, Kafka) capable of ingesting, indexing, and querying petabytes of log data.
- High Availability: Ensuring the log viewer itself is always available, even during infrastructure failures, as it's a critical component for incident response.
- Cost Optimization: Intelligent tiering of storage (hot, warm, cold) to manage costs while maintaining acceptable query performance for different data ages.
These advanced features collectively transform dynamic log viewers from simple diagnostic tools into sophisticated platforms that underpin the entire operational and development lifecycle. They empower teams to not only react faster but to proactively build and maintain more resilient, observable, and secure systems, especially critical in complex environments orchestrated by an api gateway handling countless api interactions.
Implementing and Optimizing Dynamic Log Viewers
The decision to adopt a dynamic log viewer is a significant step towards enhanced observability and smarter debugging. However, simply choosing a tool is only the beginning. Effective implementation and continuous optimization are crucial to fully realize its benefits and integrate it seamlessly into existing development and operations workflows. This involves careful consideration of tool selection, deployment strategies, logging best practices, and ongoing management.
Choosing the Right Tool: Fit for Purpose
The market offers a wide array of dynamic log viewers, ranging from open-source projects to commercial cloud-native solutions. The "right" choice depends heavily on an organization's specific needs, scale, budget, and existing technology stack.
- Open Source vs. Commercial: Open-source options (e.g., ELK stack components like Kibana, Grafana Loki) offer flexibility and cost savings but require internal expertise for setup, maintenance, and scaling. Commercial solutions (e.g., Datadog, Splunk, Sumo Logic, Logz.io) provide managed services, extensive features, and professional support, often at a higher cost. For companies already leveraging open-source components for their
api gatewayorapimanagement, an open-source log viewer might be a natural fit, allowing for greater customization and control over the data. - Cloud-Native vs. Self-Hosted: Cloud-native solutions (e.g., AWS CloudWatch Logs Insights, Google Cloud Logging) integrate deeply with cloud provider ecosystems, offering ease of deployment and managed scalability. Self-hosted solutions provide greater control over data residency and infrastructure but demand more operational overhead.
- Integration Ecosystem: Consider how well the chosen tool integrates with your existing APM, CI/CD, alerting, and incident management systems. A cohesive observability stack is far more powerful than disparate tools.
- Scalability Requirements: Evaluate the anticipated volume of log data. A tool that performs well for a small application might crumble under the load of hundreds of microservices processing millions of
apirequests per second through anapi gateway. - Pricing Model: Understand the pricing structure – usually based on data ingestion volume, retention period, or active users. Cost optimization strategies must be factored in early.
Deployment Considerations: Getting Logs to the Viewer
Once a tool is selected, the next challenge is efficiently collecting and centralizing logs:
- Agent-Based Collection: The most common method involves deploying lightweight agents (e.g., Filebeat, Fluentd, Vector) on each server, container, or VM. These agents tail log files, process them (e.g., parse, enrich), and forward them to the log aggregation system. This is highly flexible but requires agent management.
- Direct Ingestion APIs: Many dynamic log viewers provide direct
apiendpoints for applications to send logs directly. This offers fine-grained control but couples the application code more closely with the logging infrastructure. - Sidecar Containers (Kubernetes): In containerized environments, a sidecar container running a log collection agent alongside each application container is a popular pattern. This decouples logging concerns from the application container.
- Log Forwarders/Gateways: For very large-scale deployments or specific compliance needs, an intermediate log forwarder (like Kafka or a dedicated log
gateway) can act as a buffer and router, providing resilience and load balancing before logs reach the main aggregation system. - Serverless Integrations: For serverless functions (e.g., AWS Lambda), direct integrations with cloud logging services or dedicated log forwarders are necessary, as traditional agents are not applicable.
Log Format Standardization: The Power of Structured Logging
The single most impactful optimization for any dynamic log viewer is the adoption of structured logging. This moves away from arbitrary text messages to machine-readable formats like JSON or key-value pairs.
- Benefits:
- Easier Parsing: The viewer knows exactly which field contains what information (e.g.,
level,timestamp,service_name,request_id,api_endpoint). - Powerful Filtering and Search: Enables precise field-based queries.
- Better Contextualization: Ensures critical metadata (like correlation IDs propagated through the
api gateway) is consistently present and searchable. - Automated Analysis: Facilitates easier aggregation, trending, and anomaly detection.
- Easier Parsing: The viewer knows exactly which field contains what information (e.g.,
- Implementation: Encourage developers to use structured logging libraries in their respective programming languages. Standardize logging conventions across all services, ensuring consistent field names and types for common attributes like
timestamp,level,service_name, andcorrelation_id. This consistency is paramount for effective cross-service debugging, especially when tracing anapicall through multiple components.
Cost Management: Balancing Insight and Expense
Logging can be expensive, especially at scale. Proactive cost management is essential:
- Log Level Management: Only log what's necessary in production. Reduce verbose
DEBUGorTRACElogs unless explicitly needed for a specific debugging session. - Data Retention Policies: Implement tiered storage and intelligent retention. Keep critical production logs readily searchable for a shorter period (e.g., 30 days) and archive less critical or older logs to cheaper storage for longer-term compliance, if needed.
- Sampling: For extremely high-volume, non-critical logs, consider intelligent sampling to reduce ingestion costs while still providing statistical insights.
- Pre-processing and Filtering at Source: Use log collection agents to filter out irrelevant logs or redact sensitive data before sending them to the central log viewer, reducing ingestion volume and improving security.
Training and Adoption: Empowering the Users
Even the most powerful dynamic log viewer is useless if teams don't know how to use it effectively.
- Comprehensive Training: Conduct workshops and create documentation on how to use the specific log viewer, covering basic searches, advanced filtering, dashboard creation, and alert configuration.
- Best Practices for Logging: Educate developers on what to log (context, correlation IDs, relevant business events,
apirequest/response details) and how to log (structured format, appropriate log levels). - Champion Program: Designate "log viewer champions" within teams who can assist colleagues and advocate for best practices.
- Integration with Workflow: Embed the log viewer into daily workflows, e.g., linking from alerts directly to relevant log views, or integrating into incident response runbooks.
Best Practices for Logging: What and How Much Detail
The quality of logs directly impacts the utility of the dynamic log viewer.
- Log Context, Not Just Messages: Always include relevant contextual information:
user_id,request_id,session_id,api_endpoint,service_name,hostname,pod_name, etc. - Use Appropriate Log Levels:
TRACE/DEBUG: For development and detailed debugging sessions. Avoid in production unless temporary for specific issue.INFO: General application flow, significant events (e.g., "user logged in," "order placed," "externalapicall started").WARN: Non-critical issues that might indicate a potential problem (e.g., "deprecatedapiusage," "retrying operation," "slow query").ERROR: Application errors that prevent a specific operation from completing but don't crash the entire service.FATAL/CRITICAL: System-level failures that lead to service unavailability.
- Avoid Sensitive Data: Redact or mask PII, passwords, credit card numbers, and other sensitive information from logs.
- Asynchronous Logging: Implement asynchronous logging to avoid blocking application threads, which can impact performance, especially for high-volume
apitraffic passing through anapi gateway. - Log
apiRequest/Response Data: For criticalapiinteractions, especially those handled by anapi gateway, consider logging key parts of request and response bodies (sanitized for sensitive data) to aid in debugging communication issues. This level of detail, when accessible through a dynamic log viewer, can be the difference between hours and minutes of debugging.
By meticulously planning and executing these implementation and optimization strategies, organizations can transform their logging infrastructure from a passive archive into an active, intelligent partner in achieving operational excellence and fostering a culture of continuous learning and improvement.
Dynamic Log Viewers in the Context of API Management and Gateways
In the modern software landscape, Application Programming Interfaces (APIs) are the bedrock upon which virtually all digital services are built. From mobile applications communicating with backend services to intricate microservices exchanging data, and even AI models being invoked, api calls are the ubiquitous language of interconnected systems. The proliferation of APIs has, in turn, elevated the role of the api gateway – a critical component that stands at the forefront of an organization's service ecosystem, acting as a single entry point for all api requests. It handles routing, authentication, rate limiting, traffic management, and often, security policies for myriad backend services. Given this central and critical role, the data generated by an api gateway is arguably some of the most important for debugging, monitoring, and understanding system behavior. This is precisely where dynamic log viewers become not just useful, but absolutely indispensable.
The Critical Role of APIs and API Gateways
Every interaction in a distributed system often begins or passes through an api. Whether it's a customer placing an order, a financial transaction being processed, or an AI model performing sentiment analysis, an api call is the initiating event. This makes APIs the primary interface for functionality, and their health and performance are directly tied to the overall system's stability and user experience.
The api gateway, on the other hand, is the central nervous system for these api interactions. It's the first line of defense, the traffic cop, and often the point where cross-cutting concerns like security, observability, and policy enforcement are applied. Every api request from an external client or even internal services passes through the api gateway. This strategic position means the api gateway sees everything: every request, every response, every authentication attempt, every rate limit hit, and every error that propagates from an upstream service. Consequently, the logs generated by an api gateway are a goldmine of information, offering a panoramic view of system activity and potential issues.
Debugging API Issues with Dynamic Log Viewers
The logs from an api gateway and the underlying api services are rich with diagnostic information. A dynamic log viewer makes this information not just accessible but actionable in real-time, drastically simplifying the process of debugging complex api-related issues:
- Request/Response Tracing: A dynamic log viewer allows engineers to trace individual
apirequests from the moment they hit theapi gatewaythrough their journey to backend services and back. By filtering on arequest_idorcorrelation_idgenerated by thegateway, one can see the full lifecycle:- Initial
api gatewayreceipt. - Authentication and authorization checks.
- Routing decisions.
- Time taken by the backend service.
- Response processing by the
gateway. - Final response to the client. This end-to-end view is crucial for pinpointing where latency is introduced or where an error originates.
- Initial
- Authentication/Authorization Failures: When users report "access denied" errors, a dynamic log viewer can quickly filter
api gatewaylogs for401 Unauthorizedor403 Forbiddenstatus codes. It can then show associated details like theuser_id,client_ip,api_endpointattempted, and the reason for failure (e.g., "invalid token," "missing scope"), enabling rapid diagnosis of credential issues or misconfigured permissions. - Rate Limiting Issues: If a client suddenly experiences
429 Too Many Requestserrors, a dynamic log viewer can highlight these entries in real-time, revealing whichapiendpoint is being hit, by which client, and the configured rate limits. This helps determine if the client is exceeding limits, or if the rate limit configuration in theapi gatewayitself needs adjustment. - Upstream Service Errors: Often, the
api gatewaysimply forwards errors from a malfunctioning backendapiservice. A dynamic log viewer can distinguish betweengatewayinternal errors and upstream service errors by parsing status codes and error messages. If anapi gatewaylogs a500 Internal Server Errorwith a message like "Connection refused to backend service X," the engineer immediately knows to investigate service X, rather than thegatewayitself. - Latency at the
api gatewayLevel: Performance bottlenecks can occur at theapi gatewayitself due to misconfigurations, overloaded resources, or complex policy executions. By monitoring logs forrequest_durationorgateway_processing_timemetrics (if logged), a dynamic log viewer can alert to or highlight unusual latency spikes within theapi gateway, indicating a need for optimization or scaling of thegatewayinfrastructure.
When dealing with api gateway solutions, such as APIPark, which serves as an open-source AI gateway and API management platform, the sheer volume of log data generated from hundreds or thousands of API calls can be overwhelming. APIPark's commitment to detailed API call logging, performance rivaling Nginx, and end-to-end API lifecycle management makes it a powerful producer of diagnostic information. However, merely generating logs is only half the battle; interpreting them effectively is where dynamic log viewers truly shine. They allow engineers to actively monitor API calls passing through the api gateway, filter by specific api endpoints, identify authentication failures, trace request paths, and pinpoint performance bottlenecks in real-time. This dynamic interaction with APIPark's comprehensive logs drastically reduces the time needed to debug issues, ensuring system stability and data security as promised by APIPark's core features. For instance, APIPark's capability to quickly integrate 100+ AI models means its gateway handles a diverse range of AI api invocations. A dynamic log viewer would be instrumental in monitoring the unique log patterns of these AI models, flagging any inference errors or unexpected response times immediately, allowing AI developers to fine-tune their models or prompts without disrupting the main application or microservices.
Let's illustrate the distinction between traditional and dynamic log viewing in the context of api gateway debugging:
| Feature/Aspect | Traditional Log Viewing (e.g., grep on file) |
Dynamic Log Viewing (Interactive Platform) |
|---|---|---|
| Data Source | Single local log file, or limited set of files accessible via SSH. | Aggregated from all services, api gateway instances, and infrastructure. |
| Real-time Access | Limited to tail -f on one file; no aggregation. |
Live streaming from all sources, constantly updating. |
| Filtering/Search | grep, awk, sed - command-line, complex, often slow. |
Intuitive UI with advanced field-based, regex, boolean queries. Very fast. |
| Correlation | Manual grep across multiple files for a request_id, very hard. |
Automatic grouping of logs by correlation_id across all services. |
| Context | Fragmented, requires jumping between terminals/files. | Unified view, contextual linking, drill-down capabilities. |
| Speed of Diagnosis | Hours, days (especially for intermittent/distributed issues). | Minutes, seconds (real-time problem identification). |
| Proactive Monitoring | Almost non-existent, relies on reactive alerts. | Continuous observation, anomaly detection, threshold-based alerts. |
| Collaboration | Sharing file snippets or screenshots; lacks live context. | Sharing live filtered views, enabling joint real-time debugging. |
| Data Volume Handling | Struggles with high volume, performance degrades significantly. | Designed for petabytes of data, optimized for speed. |
| User Experience | Steep learning curve for complex commands, error-prone. | Intuitive graphical interface, reduces cognitive load. |
| Cost | Free (if already using OS tools); high human cost. | Software licensing/subscription; significantly reduced human operational cost. |
This comparison clearly underscores why dynamic log viewers are not merely an enhancement but a fundamental shift in how teams approach debugging and operations, particularly for api-centric architectures. The ability to quickly trace an api call, identify a misconfigured api gateway rule, or pinpoint a slow backend service in real-time transforms incident response from a chaotic scramble into a precise, efficient operation. By fully leveraging the detailed logging capabilities of platforms like APIPark with the interactive power of dynamic log viewers, organizations can achieve unparalleled visibility and control over their complex distributed systems.
Future Trends in Log Management: Evolving Beyond the Basics
The landscape of log management is continuously evolving, driven by the increasing complexity of software systems, the relentless growth in data volumes, and the overarching need for deeper, more immediate insights. While dynamic log viewers represent a significant leap forward, the journey towards ultimate observability is ongoing. Future trends are pushing the boundaries even further, integrating artificial intelligence, converging different data types, and enhancing user interaction to deliver even smarter, more automated insights.
AI/ML for Anomaly Detection and Predictive Analytics
One of the most promising frontiers in log management is the application of Artificial Intelligence and Machine Learning. Raw log data, especially at scale, is too vast for human analysis alone to catch every subtle anomaly. AI/ML algorithms can:
- Baseline Normal Behavior: Learn what "normal" log patterns, frequencies, and message types look like for specific services or
apiendpoints. - Automated Anomaly Detection: Instantly flag deviations from this baseline, such as a sudden spike in a particular warning message, an unusual sequence of events, or a change in the average latency of
apicalls. This moves beyond simple thresholding to identify more nuanced, complex anomalies that might be precursors to major incidents. - Root Cause Suggestion: Analyze patterns across logs, metrics, and traces to suggest potential root causes for observed issues, drastically accelerating the diagnostic process.
- Predictive Analytics: By identifying recurring patterns that precede failures, AI can predict future outages or performance degradations, allowing for proactive intervention before an issue even manifests. For example, a specific series of
api gatewaywarnings followed by memory pressure on a backend service could be a known precursor pattern for a service crash.
This infusion of intelligence transforms dynamic log viewers from reactive tools into proactive, predictive engines, making smarter debugging truly intelligent.
Observability Platforms: Logs, Metrics, Traces Converge
The concept of "observability" is gaining traction, advocating for a holistic view of system health by integrating three pillars: logs, metrics, and traces. While dynamic log viewers excel at logs, future trends will see a tighter convergence:
- Unified UI: A single platform where users can seamlessly pivot between logs, metrics (e.g., CPU utilization, request rate for an
api), and distributed traces (showing the end-to-end path of a request through services). - Automatic Context Switching: Clicking on a slow
apicall in a trace view could automatically open the corresponding logs and metrics for that specific request and service within the dynamic log viewer, providing immediate, deep context. - Cross-Correlation: Intelligent systems that automatically correlate events across all three data types to identify complex relationships that might be missed when analyzing them in isolation. This allows for a richer understanding of how, for example, a spike in
api gatewayerrors (logs) correlates with a drop in success rate (metrics) and a failure at a specific microservice (trace).
This convergence provides a more complete "story" of system behavior, moving beyond fragmented insights to a truly comprehensive understanding.
Context-Aware Logging and Automatic Enrichment
Future logging practices will become even more intelligent by automatically enriching log data with additional context at the point of ingestion or viewing:
- Geolocation Data: Automatically adding client IP geolocation to
api gatewaylogs to understand geographical distribution of users or attack origins. - User Information: Integrating with identity systems to automatically add user attributes (e.g.,
department,role) to log entries based on theiruser_id. - Deployment Metadata: Automatically injecting details about the current deployment (e.g.,
git_commit_hash,build_version) into all logs from a service, making it easy to tie log events back to specific code changes. - Schema Inference: Automatically detecting and inferring schemas for structured logs, even if they aren't explicitly defined, making previously unstructured logs more queryable.
This enrichment reduces the burden on developers to manually add every piece of context and makes dynamic log viewing even more powerful for business and operational analysis.
Interactive Log Query Languages
While current dynamic log viewers offer powerful filtering, future trends point towards even more expressive and interactive query languages. Inspired by data analysis tools, these languages will enable:
- Complex Data Transformations: Allowing users to transform, aggregate, and visualize log data directly within the query interface (e.g., calculate average
apilatency perapi_endpointover the last hour, then sort). - Ad-hoc Reporting: Enabling operations teams to generate custom reports and analytics on the fly, without needing to pre-configure dashboards.
- Natural Language Processing (NLP): Eventually, systems might allow for natural language queries, translating human questions into complex log queries (e.g., "Show me all errors for the payment
apiin the last 30 minutes where the user was from Europe").
This will democratize access to log insights, making complex analysis accessible to a broader range of users.
Serverless Logging Challenges and Solutions
The rise of serverless architectures (e.g., AWS Lambda, Google Cloud Functions) presents unique logging challenges, as traditional agent-based collection is not applicable. Future trends will focus on:
- Integrated Cloud Logging: Deeper integrations with cloud provider-specific logging services, offering enhanced query capabilities and real-time streaming directly from serverless functions.
- Distributed Tracing for Serverless: Ensuring that correlation IDs are propagated seamlessly across serverless function invocations to provide end-to-end traces, even in highly ephemeral environments.
- Cost-Effective Logging for Ephemeral Functions: Optimizing log collection and storage for functions that run for milliseconds, ensuring that valuable diagnostic data is captured without incurring excessive costs.
The future of log management, and by extension, dynamic log viewers, is one of increasing intelligence, integration, and automation. These advancements promise to further reduce the time spent debugging, enhance system resilience, and provide an unprecedented level of understanding into the behavior of complex, distributed software systems, ensuring that api interactions and api gateway operations are not just monitored, but truly understood and optimized.
Conclusion
In the relentless march of technological progress, where applications are becoming increasingly distributed, interconnected, and complex, the unassuming log file has transformed from a mere debugging aid into an indispensable cornerstone of system observability. The sheer volume and intricate nature of log data generated by modern architectures, particularly those built upon a foundation of countless api interactions and orchestrated by sophisticated api gateway solutions, have rendered traditional, static log viewing methods obsolete. The demand for immediate, contextual, and actionable insights has given rise to the dynamic log viewer – a powerful category of tools that fundamentally redefines how we interact with the pulse of our digital systems.
Throughout this extensive exploration, we have delved into the profound impact of dynamic log viewers. We've traced the evolution from rudimentary print statements to the challenges of distributed logging, highlighting the critical gap that dynamic viewers expertly bridge. We’ve meticulously defined their core characteristics, emphasizing their real-time streaming capabilities, advanced filtering, and contextualization features that transform raw data into a coherent narrative. The discussion illuminated why these tools are crucial for gaining real-time insights, enabling immediate problem identification, proactive performance monitoring, robust security auditing, and accelerated root cause analysis, thereby significantly reducing the Mean Time To Resolution (MTTR).
Furthermore, we explored the concept of "smarter debugging," demonstrating how dynamic log viewers empower engineers to move beyond reactive fixes towards a proactive understanding of system behavior. The synergy between structured logging and dynamic viewing, coupled with sophisticated filtering strategies and pattern recognition, facilitates a deeper, more intelligent approach to problem-solving. We examined the panoply of key features and advanced capabilities, from intelligent alerting to customizable dashboards and robust integration ecosystems, showcasing how these tools function as comprehensive diagnostic workbenches. The journey also covered the practicalities of implementation and optimization, underscoring the importance of tool selection, deployment strategies, and crucial best practices for logging, ensuring that the investment in these powerful systems yields maximum return.
Critically, we emphasized the unparalleled value of dynamic log viewers within the specific context of api management and api gateway operations. In an environment where every digital transaction traverses an api and is routed by an api gateway, the ability to trace, filter, and analyze these critical logs in real-time is not merely an advantage – it is a strategic imperative. The detailed api call logging capabilities of platforms like APIPark, an open-source AI gateway and API management platform, become exponentially more powerful when their rich data is fed into a dynamic log viewer. This symbiosis enables engineers to swiftly diagnose issues ranging from authentication failures and rate-limiting problems to upstream service errors and api gateway latency, transforming a potentially chaotic debugging process into a streamlined, efficient operation.
Looking ahead, the future of log management promises even greater sophistication, with AI/ML-driven anomaly detection, the convergence of logs, metrics, and traces into holistic observability platforms, and increasingly intelligent, context-aware logging practices. These evolving trends will further enhance the capabilities of dynamic log viewers, pushing the boundaries of what's possible in real-time system understanding and proactive problem resolution.
In conclusion, for any organization striving to build robust, resilient, and performant software systems in today's complex digital landscape, embracing dynamic log viewers is no longer optional. They are indispensable tools that provide the eyes and ears necessary to navigate the intricate world of distributed systems, empower smarter debugging, and ultimately ensure the continuous delivery of exceptional user experiences. By harnessing the power of real-time log insights, we don't just fix problems faster; we build better, more intelligent, and more observable software that stands the test of time.
5 Frequently Asked Questions (FAQs)
1. What is the fundamental difference between a traditional log viewer and a dynamic log viewer?
The fundamental difference lies in their interaction with log data and immediacy. A traditional log viewer, like opening a file with less or using grep, provides a static snapshot or a basic, command-line tail of a single, often local, log file. It requires manual effort to refresh, search across multiple files, or correlate events. A dynamic log viewer, in contrast, offers a live, continuously updating stream of aggregated log entries from across an entire distributed system. It provides an interactive graphical interface with advanced filtering, searching, and correlation capabilities (e.g., by request_id), allowing engineers to analyze and manipulate log streams in real-time. This dynamic nature enables immediate problem identification and drastically reduces the time needed for debugging compared to the reactive, labor-intensive process of traditional viewing.
2. Why are dynamic log viewers particularly important for systems using an api gateway?
Systems using an api gateway centralize all api traffic, making the gateway a critical choke point and a rich source of diagnostic information. An api gateway logs every request, response, authentication attempt, routing decision, and error, potentially for hundreds or thousands of api endpoints and numerous backend services. This generates an immense volume of highly diverse log data. Dynamic log viewers are crucial here because they can: * Aggregate logs from all api gateway instances and backend services into a single stream. * Allow real-time monitoring of all api calls and their statuses. * Enable granular filtering by api endpoint, client ID, status code (e.g., 401, 500), or correlation_id to trace specific transactions. * Quickly identify issues like authentication failures, rate limiting breaches, or errors originating from upstream services as they happen at the gateway level. Without a dynamic log viewer, making sense of the api gateway's log torrent for real-time debugging would be an overwhelming and often impossible task.
3. How does structured logging improve the effectiveness of a dynamic log viewer?
Structured logging, typically using formats like JSON, enhances a dynamic log viewer's effectiveness by making log data machine-readable and highly queryable. Instead of free-form text, structured logs break down each entry into explicit key-value pairs (e.g., {"level": "error", "service": "payment", "request_id": "xyz"}). This allows the dynamic log viewer to: * Perform precise field-based filtering and searches (e.g., level:error AND service:payment). * Automatically extract and display relevant metadata without complex parsing. * Enable advanced aggregations and analytics (e.g., counting errors per service, calculating average latency for an api endpoint). * Facilitate seamless correlation of logs across different services using common fields like request_id. In essence, structured logging transforms raw log text into a queryable database, unlocking the full power and precision of a dynamic log viewer for smarter debugging and analysis.
4. Can dynamic log viewers help with proactive monitoring, or are they only for reactive debugging?
Dynamic log viewers are highly effective for proactive monitoring, moving beyond just reactive debugging. While excellent for quickly diagnosing active incidents, their real-time streaming capabilities allow engineers to continuously observe system behavior. By setting up saved filtered views, custom dashboards, and threshold-based alerts, teams can: * Identify subtle anomalies or unusual patterns in log volumes or message types before they escalate into major problems. * Monitor performance metrics derived from logs, like api call latencies, to spot performance degradations early. * Track security-related events for suspicious activities as they occur. * Gain an intuitive understanding of "normal" system operation, making deviations instantly noticeable. Coupled with features like AI/ML-driven anomaly detection (in more advanced platforms), dynamic log viewers empower teams to anticipate and prevent issues, significantly contributing to system stability and resilience.
5. How does a product like APIPark complement the use of a dynamic log viewer?
APIPark, as an open-source AI gateway and API management platform, is a powerful producer of comprehensive and detailed log data, making it an ideal source for a dynamic log viewer. APIPark's core features include "Detailed API Call Logging" and "End-to-End API Lifecycle Management," meaning it meticulously records every aspect of api interactions passing through its gateway. A dynamic log viewer then acts as the essential consumer and analyzer of these logs. * Data Source: APIPark generates the rich, structured log data about api calls, authentication, routing, and AI model invocations. * Real-time Interaction: A dynamic log viewer enables developers and operations teams to interact with APIPark's generated logs in real-time, observing the live flow of api traffic and immediate feedback on system behavior. * Deeper Insights: It allows for granular filtering of APIPark's logs by specific api endpoints, client IDs, error codes, or request_ids, providing rapid diagnosis of issues managed by APIPark (e.g., api gateway errors, authentication failures, AI model inference problems). In essence, APIPark provides the high-fidelity raw information, and a dynamic log viewer unlocks its full potential by making that information immediately accessible, searchable, and actionable for smarter debugging and comprehensive system understanding.
🚀You can securely and efficiently call the OpenAI API on APIPark in just two steps:
Step 1: Deploy the APIPark AI gateway in 5 minutes.
APIPark is developed based on Golang, offering strong product performance and low development and maintenance costs. You can deploy APIPark with a single command line.
curl -sSO https://download.apipark.com/install/quick-start.sh; bash quick-start.sh

In my experience, you can see the successful deployment interface within 5 to 10 minutes. Then, you can log in to APIPark using your account.

Step 2: Call the OpenAI API.