Optimize Container Average Memory Usage for Peak Performance


In the relentless pursuit of efficiency and responsiveness, modern application architectures increasingly rely on containerization. Containers, with their lightweight and portable nature, have revolutionized how software is developed, deployed, and scaled. However, the promise of resource efficiency often collides with the reality of poorly optimized deployments, leading to wasted resources, increased costs, and, critically, performance bottlenecks. Among the myriad factors influencing container performance, memory usage stands out as a particularly crucial, yet frequently misunderstood, dimension. Optimizing the average memory usage of containers is not merely about saving a few dollars on cloud bills; it is a foundational pillar for achieving peak performance, robust stability, and sustainable scalability in any containerized environment.
This comprehensive guide delves into the intricacies of container memory management, exploring why average memory usage is a more telling metric than peak usage alone, the common pitfalls that inflate memory footprints, and a spectrum of advanced strategies to meticulously tune your containers for maximum performance. From application-level code refinements to host-level kernel adjustments and sophisticated monitoring techniques, we will embark on a journey to unlock the full potential of your containerized applications, ensuring they operate with lean efficiency and unwavering reliability, even under the most demanding loads. The principles discussed here are universally applicable, whether you are running a simple microservice or a complex, high-throughput system like an api gateway processing millions of requests per second.
The Unseen Battle: Understanding Container Memory
Before we can optimize, we must first understand the landscape. Memory within a containerized environment is a shared, yet finite, resource. Unlike traditional virtual machines that emulate dedicated hardware, containers share the host operating system's kernel and, by extension, its memory management capabilities. This shared nature is what makes containers lightweight, but also introduces complexities in resource isolation and allocation.
Cgroups and Namespaces: The Linux Foundation
At the heart of Linux container technology (like Docker and Kubernetes) are two fundamental kernel features: control groups (cgroups) and namespaces. * Namespaces provide isolation. They partition global system resources, making it appear to a process inside a container as if it has its own independent view of the system's process IDs, network interfaces, mount points, and, critically for our discussion, memory. This creates the illusion of a self-contained environment. * Cgroups, on the other hand, are about resource management and accounting. They allow the operating system to allocate, prioritize, deny, manage, and monitor system resources such as CPU, memory, network I/O, and block I/O for groups of processes. For memory, cgroups enable the definition of limits (memory.limit_in_bytes) and soft limits (memory.soft_limit_in_bytes), as well as tracking usage (memory.usage_in_bytes). When a container exceeds its memory limit, the Linux kernel's Out-Of-Memory (OOM) killer steps in, often terminating the container abruptly, leading to service disruption.
Demystifying Memory Metrics: RSS, VSS, and the Working Set
Understanding the various memory metrics is crucial for accurate diagnosis and optimization. * Virtual Set Size (VSS): This represents the total amount of virtual memory that a process has reserved. It includes all code, data, shared libraries, and mapped files, even if they are not currently in physical RAM. VSS is often misleading for gauging actual memory pressure because much of it might be virtual and never actually used. * Resident Set Size (RSS): This is a much more important metric. RSS indicates the amount of physical memory (RAM) that a process is currently occupying. It excludes memory that is swapped out and shared libraries if they are not actively loaded into RAM for that process. RSS gives a closer approximation of a container's true memory footprint. However, even RSS can be deceiving as it includes file-backed pages (like code segments or memory-mapped files) that might be shared with other processes or easily reclaimable by the kernel. * Private RSS: A refined version of RSS, private RSS specifically counts the amount of physical memory used by a process that is not shared with any other process. This is often the most critical metric for understanding a container's individual memory consumption, as it represents memory that cannot be easily freed or shared. * Working Set: This is an informal but highly valuable concept. The working set of a process or container refers to the set of memory pages that are actively being accessed by the application at any given time. This is the memory that, if not present in physical RAM, would cause a page fault, leading to a performance degradation as the system retrieves it from slower storage (like swap or disk). Optimizing average memory usage often means shrinking the working set without sacrificing performance. * Cache vs. Application Memory: The Linux kernel aggressively uses available RAM for disk caching to speed up I/O operations. While this cached memory is reported as "used" by the system, it is readily reclaimable when applications require more physical memory. Container memory usage metrics typically include both application memory and any file system cache pages associated with that container. It's important to differentiate between these; high cache usage isn't necessarily bad if it’s easily reclaimable, but high application (private RSS) usage is a direct indicator of memory consumption.
The Significance of "Average" Memory Usage
Why focus on average memory usage rather than just peak usage? Peak usage, while important for setting hard limits to prevent OOMKills, can be an anomaly. A container might momentarily spike its memory usage during initialization, a batch job, or a specific, infrequent operation. However, its average memory consumption over extended periods, particularly during its typical operational load, is far more indicative of its true resource demands and efficiency.
- Cost Efficiency: Cloud providers charge for allocated resources, not just peak usage. If your container's average memory usage is significantly lower than its allocated limit, you are paying for unused RAM. Optimizing average usage directly translates to cost savings.
- Resource Scheduling and Density: Orchestrators like Kubernetes schedule pods onto nodes based on their resource requests. If containers request more memory than they typically need (based on peak usage), fewer containers can be scheduled per node, leading to underutilized nodes and higher infrastructure costs. Optimizing average usage allows for higher container density per node.
- Predictability and Stability: A container with a consistently low and predictable average memory footprint is less prone to sudden OOMKills or performance degradation due to memory pressure. This predictability is vital for maintaining service level agreements (SLAs) and ensuring overall system stability, especially for critical components like an api gateway.
- Scalability: When scaling out services, particularly stateless ones, the average memory footprint of each instance dictates the total memory required for a given scale. A lean average means you can scale further with the same underlying infrastructure.
The Cost of Inefficiency: Why Memory Optimization Matters
Ignoring container memory optimization is akin to driving a car with a perpetually overflowing fuel tank – wasteful, inefficient, and potentially hazardous. The repercussions extend beyond mere resource consumption, touching upon performance, stability, and even the financial viability of your operations.
Performance: Reduced Latency and Increased Throughput
Every byte of memory consumed contributes to the working set. If the working set exceeds the available physical memory, the operating system resorts to swapping pages to disk, a significantly slower operation that introduces latency. This phenomenon, known as "thrashing," cripples performance, causing requests to take longer and reducing the overall throughput of the system. For high-performance applications, such as a transactional service or an api gateway handling a massive volume of concurrent requests, even minor memory inefficiencies can translate into unacceptable response times and a diminished user experience. An api call that takes milliseconds longer due to memory contention can compound into significant system-wide delays.
Stability: Preventing OOMKills and Unpredictable Behavior
The Linux OOM killer is a necessary evil. When the system runs out of physical memory, it arbitrarily terminates processes to reclaim resources. In a containerized environment, this often means your entire container is terminated without warning. OOMKills are catastrophic, leading to service outages, data corruption, and difficult-to-diagnose issues. Containers with high and unpredictable memory usage are prime candidates for OOMKills, especially under varying load patterns or resource contention on the host. Optimizing average memory usage makes your containers more resilient, reducing the likelihood of these disruptive events and enhancing the overall stability of your platform.
Cost Efficiency: Maximizing Resource Utilization
Cloud computing bills are directly tied to resource allocation. If your containers are configured with generous memory limits and requests to accommodate infrequent peak usage, but their average consumption is low, you are paying for resources that are largely idle. This "memory bloat" leads to significant over-provisioning and inflated infrastructure costs. By meticulously optimizing average memory usage, you can run more containers on fewer nodes, or utilize smaller, more cost-effective instance types, directly impacting your bottom line. This is particularly relevant for environments with many microservices or a large number of api endpoints.
Scalability: Smoother Operations and Reduced Bottlenecks
Scalability hinges on predictable resource consumption. When each instance of a service has a well-understood, optimized memory profile, scaling out becomes a straightforward process. You can confidently estimate the resources required for additional load, avoiding bottlenecks and ensuring that your infrastructure scales linearly with demand. Conversely, erratic or excessive memory usage per container makes scaling a guessing game, often leading to over-provisioning (costly) or under-provisioning (performance issues and instability). A well-optimized gateway or microservice can scale horizontally with far greater ease and efficiency.
Common Causes of Bloated Memory Usage in Containers
Identifying the root causes of high memory consumption is the first step towards effective optimization. The problem often isn't a single culprit but a confluence of factors spanning application code, runtime configurations, and deployment practices.
1. Memory Leaks and Unreleased Resources
This is perhaps the most insidious cause. A memory leak occurs when an application continuously allocates memory but fails to release it when it's no longer needed. Over time, the container's memory footprint steadily grows until it exhausts its limits, leading to an OOMKill. Common sources include: * Improper Object Lifecycle Management: Failing to close database connections, file handles, network sockets, or other system resources. * Unbounded Caches: Caches that grow indefinitely without eviction policies. * Event Listener Accumulation: In frameworks with event-driven architectures, listeners might not be properly de-registered, leading to orphaned objects. * Circular References: In garbage-collected languages, complex object graphs with circular references can sometimes prevent objects from being collected, especially in older or less sophisticated garbage collectors.
2. Inefficient Application Code and Data Structures
The choice of algorithms and data structures has a profound impact on memory usage. * Excessive Object Creation: Frequent creation of large, short-lived objects can put pressure on the garbage collector and temporarily inflate memory. * Redundant Data Storage: Storing the same data in multiple places or holding onto large datasets longer than necessary. * Inefficient Data Structures: Using ArrayList when LinkedList might be better for frequent insertions/deletions, or choosing a HashMap for a small, fixed set of keys when a simple array would suffice. Deserializing entire large JSON or XML payloads when only a small portion is needed. * Logging Verbosity: Overly verbose logging, especially at high request rates, can consume significant memory buffers before logs are flushed.
3. Suboptimal Language Runtime and Garbage Collection Settings
Different programming languages have distinct memory management characteristics. * Java Virtual Machine (JVM): JVMs are notorious for their initially large memory footprint due to various heap sizes, metaspace, and garbage collector configurations. Default JVM settings are often geared towards large server environments and can be overly generous for small containerized microservices. Incorrect garbage collector tuning can lead to long GC pauses or, conversely, frequent minor GCs that consume CPU cycles without effectively reclaiming memory. * Go: While Go is celebrated for its efficiency, unmanaged goroutines or large allocations without proper management can still lead to increased memory usage. Go's garbage collector is mostly hands-off, but understanding its triggers and behavior is important. * Node.js (V8 Engine): JavaScript engines like V8 (used in Node.js) have their own garbage collection strategies. Memory usage can spike due to large request bodies, complex object graphs, or prolonged holding of references in closures. * Python: Python's CPython interpreter uses reference counting and a generational garbage collector. High memory usage can arise from large lists, dictionaries, or objects, especially when dealing with data processing.
4. Bloated Base Images and Unnecessary Dependencies
The foundation of your container matters. * Large Base Images: Using a full-fledged OS like Ubuntu or CentOS as a base image often includes numerous utilities and libraries that your application doesn't need, adding megabytes or even gigabytes to the image size and potential runtime memory footprint. * Unused Libraries/Packages: Installing development tools, debuggers, or libraries that are only required during the build phase but are shipped with the final container image. * Sidecar Containers/Agents: While beneficial for observability or service mesh functionality, sidecar containers (e.g., Prometheus exporters, Istio proxies) add their own memory overhead to each pod.
5. Excessive In-Application Caching
While caching is essential for performance, over-caching or poorly managed caches can lead to significant memory consumption. If an application attempts to cache too much data in-memory, particularly data that is rarely accessed or expires quickly, it becomes a memory drain rather than an optimization. Without proper eviction policies (LRU, LFU, TTL), caches can grow unboundedly.
6. Configuration Overheads
Sometimes, the memory usage is influenced by configuration files. For example, loading large configuration files (e.g., thousands of firewall rules for a gateway or complex routing tables) entirely into memory at startup can contribute to a significant base footprint. Similarly, verbose logging settings can fill buffers more rapidly.
7. Kernel-level Interactions and Overheads
Even with cgroups, the kernel's memory management can introduce complexities. For instance, processes might rely on Transparent Huge Pages (THP), which can improve performance but might also lead to higher overall memory usage by allocating larger, less granular memory blocks. Understanding how the kernel manages memory within your specific environment is also key.
Strategies for Optimizing Average Memory Usage
Optimizing container average memory usage requires a multi-faceted approach, addressing issues from the application code to the container runtime and the underlying infrastructure. This isn't a one-time fix but an ongoing process of profiling, tuning, and monitoring.
A. Application-Level Optimizations
These are often the most impactful changes, as they address the source of memory consumption directly.
1. Code Refactoring and Algorithmic Efficiency
- Review Data Structures: Re-evaluate the choice of data structures. For large collections, consider more memory-efficient alternatives (e.g.,
byte[]instead ofString[]for raw data,BitSetfor boolean flags, specialized collections for specific use cases). - Optimize Data Handling:
- Streaming vs. Loading All: Instead of loading entire files or large API responses into memory, use streaming parsers (e.g., SAX for XML,
json.Decoderin Go for JSON) to process data chunk by chunk. This is critical for services that process large payloads, such as an api handler for file uploads or complex data transformations. - Lazy Loading: Load data only when it's actually needed, rather than pre-loading everything at startup.
- Reduce Duplication: Avoid holding multiple copies of the same data in memory unless absolutely necessary.
- Streaming vs. Loading All: Instead of loading entire files or large API responses into memory, use streaming parsers (e.g., SAX for XML,
- Algorithm Efficiency: Algorithms with high space complexity (e.g., O(N^2) or O(2^N) space) can quickly consume vast amounts of memory for large inputs. Opt for algorithms with lower space complexity where possible.
- Resource Pooling: Implement object pooling for expensive-to-create objects (e.g., database connections, threads, large buffers) to reduce allocation/deallocation overhead and associated memory churn.
2. Language-Specific Garbage Collection (GC) Tuning
Properly configuring the GC for your chosen language can significantly influence memory usage and performance.
- Java (JVM):
- Heap Sizing: Instead of relying on default JVM heuristics (which often allocate 1/4 of physical RAM), explicitly set initial (
-Xms) and maximum (-Xmx) heap sizes. Start with a conservativeXmxvalue (e.g., 256MB, 512MB) and increase as needed. For containerized environments,XmsandXmxshould often be set to the same value to prevent heap resizing overhead and ensure predictable memory behavior. - Garbage Collector Choice: Modern JVMs offer various GCs (G1, Parallel, Shenandoah, ZGC). G1 is a good general-purpose collector. For very low latency requirements, Shenandoah or ZGC might be considered, though they might come with higher baseline memory usage. Ensure the JVM is aware it's running in a container (Java 9+ usually handles this well with cgroup settings, but older versions might need
-XX:+UseContainerSupport). - Metaspace: Adjust
-XX:MaxMetaspaceSizeif you encounterOutOfMemoryError: Metaspaceissues, but keep it as tight as possible. - Other Parameters: Explore parameters like
-XX:SurvivorRatio,-XX:NewRatioto fine-tune young and old generation sizes.
- Heap Sizing: Instead of relying on default JVM heuristics (which often allocate 1/4 of physical RAM), explicitly set initial (
- Go: While Go's GC is mostly automatic, understanding its
GOGCenvironment variable can be helpful. By default, the GC aims to run when the heap size doubles. LoweringGOGC(e.g.,GOGC=50) makes the GC more aggressive but consumes more CPU. Raising it allows for larger heaps but less frequent GC. - Node.js (V8):
--max-old-space-size: This flag limits the V8 heap size. Adjust it to prevent the Node.js process from consuming too much memory.--expose-gc: Use this for advanced debugging and manual GC triggers, but avoid in production.
- Python:
- Python's garbage collector mostly cleans up cycles. Reference counting handles most objects. For large datasets, consider libraries like
numpyorpandaswhich often use C extensions for more memory-efficient operations. - Be mindful of object references. Ensure objects are properly de-referenced when no longer needed to allow the GC to collect them.
- Python's garbage collector mostly cleans up cycles. Reference counting handles most objects. For large datasets, consider libraries like
3. Memory Profiling and Leak Detection
This is a non-negotiable step for any serious memory optimization effort. * Profiling Tools: * Java: VisualVM, JProfiler, YourKit. * Go: pprof (built-in CPU, memory, goroutine profiler). * Node.js: Chrome DevTools (for browser-based apps but also useful for Node.js), heapdump, node-memwatch. * Python: memory_profiler, objgraph, guppy/heapy. * General: valgrind (for C/C++ based services or understanding underlying library memory usage). * Heap Dumps: Taking a snapshot of the application's memory (a heap dump) at different points in time (e.g., startup, steady state, after a suspected leak) allows you to analyze object allocations, identify large objects, and trace references to pinpoint memory leaks. Look for objects whose count or size continuously grows without bound. * Flame Graphs: Visualize memory allocation patterns and identify hot spots in your code where memory is heavily allocated.
4. Efficient Logging
Logging can consume surprising amounts of memory, especially in high-throughput applications. * Structured Logging: Use structured logging (JSON, Logfmt) for better parsing and analysis, and ensure only necessary data is logged. * Asynchronous Logging: Implement asynchronous logging to offload logging operations from the critical request path, preventing memory buffers from backing up. * Log Level Management: Dynamically adjust log levels in production to avoid verbose debugging output that consumes memory. * External Logging Aggregators: Rely on external logging systems (e.g., Elasticsearch, Loki, Splunk) to centralize and store logs, rather than having containers buffer large volumes of logs internally.
B. Container/Runtime-Level Optimizations
These optimizations focus on how the container itself is built and run, independent of the specific application logic.
1. Right-Sizing Memory Limits and Requests
This is a continuous, iterative process, and perhaps the most direct way to manage container memory. * Observe and Measure: Do not guess. Run your application under realistic load conditions (average, peak, stress tests) and meticulously measure its private RSS and working set memory usage over time. Look at percentile data (P95, P99) to understand typical usage and potential spikes. * Set Requests: Set memory.request in Kubernetes (or similar in other orchestrators) to the average working set memory of your container under typical load. This tells the scheduler how much memory to reserve, ensuring your container gets a baseline. * Set Limits: Set memory.limit to accommodate the occasional peak usage, giving a buffer above the request. A common pattern is to set limit to 1.2x to 1.5x of request, but this depends heavily on the application's memory profile. The goal is to set the limit as tight as possible without triggering OOMKills. Setting limit too high defeats the purpose of optimization, as it allows for over-provisioning and reduces density. * Iterate: Continuously monitor memory usage after deployment. If containers are constantly getting OOMKilled, increase the limit. If they consistently use much less memory than requested, decrease the request and limit. This feedback loop is crucial.
2. Leaner Base Images
The base image you choose significantly impacts the final image size and runtime memory footprint. * Alpine Linux: Known for its extremely small size (around 5MB), Alpine is an excellent choice for static binaries (Go) or environments where every MB counts. Be aware that Alpine uses musl libc instead of glibc, which can sometimes cause compatibility issues with certain compiled binaries or Python packages. * Distroless Images: These images (from GoogleContainerTools) contain only your application and its direct runtime dependencies, completely stripping out package managers, shells, and other OS utilities. They are extremely secure and lightweight. Ideal for compiled languages like Go, Java, or C++. * Smaller Official Images: Many language runtimes (e.g., python:slim, node:slim, openjdk:jre-slim) offer smaller variants of their official images. * Multi-stage Builds: Use multi-stage Docker builds to separate the build environment from the runtime environment. This allows you to include large build tools (compilers, SDKs) in an initial stage and then copy only the compiled application artifacts into a much smaller, lean final image. This significantly reduces image size, which in turn reduces disk I/O for fetching images and potentially less memory used for filesystem caching.
3. Minimizing Installed Dependencies
Every package installed in your container image adds to its size and potentially its memory footprint at runtime. * Only Install What's Needed: Review your Dockerfile or package manager configurations (apt, yum, npm, pip, go mod) to ensure you are only installing essential runtime dependencies. * Remove Build Dependencies: After compiling your application, remove development headers, compilers, and other build-time dependencies that are not needed for runtime. Multi-stage builds largely automate this. * Consolidate Libraries: If multiple microservices use the same shared libraries, consider if they can share a common base layer or if the duplication is justified.
4. Leveraging Linux Kernel Features
Advanced kernel tuning can sometimes yield further memory efficiencies, though these are typically done at the host level. * OOM Killer Tuning: Adjust oom_score_adj for critical containers to make them less likely targets for the OOM killer, or memory.oom.group to ensure if one container in a cgroup gets OOM-killed, only that container is affected, not the entire cgroup. * Transparent Huge Pages (THP): THP can improve performance by using larger memory pages, reducing TLB miss rates. However, it can also lead to higher overall memory usage as it rounds up allocations to page boundaries. For some workloads, disabling THP can reduce average memory footprint. Test thoroughly.
5. Container Orchestrator Settings (Kubernetes Specific)
Kubernetes offers powerful resource management features that, when correctly configured, ensure optimal memory utilization.
- QoS Classes:
- Guaranteed:
requests == limitsfor both CPU and memory. Provides the highest priority and stability. Ideal for critical services like a gateway. - Burstable:
requests <= limits(and not all requests are 0). Most common, offers flexibility but can be OOM-killed if the node is under memory pressure and other pods are guaranteed. - BestEffort: No requests or limits. Lowest priority, first to be OOM-killed. Never use for production workloads.
- Guaranteed:
- Pod Disruption Budgets (PDBs): While not directly memory-related, PDBs ensure that a minimum number of pods for a service remain available during voluntary disruptions (e.g., node upgrades), contributing to overall stability.
- Vertical Pod Autoscaler (VPA): VPA can automatically adjust
requestsandlimitsfor pods based on historical usage, making it a powerful tool for optimizing average memory usage without manual intervention. However, it has implications for node scheduling and resource stability, so use with caution and proper testing.
C. Architectural Considerations
Sometimes, the memory problem isn't just about a single container but the overall system design.
1. Microservice Granularity
- Right-sizing Microservices: Services that do too many things might accumulate a large number of dependencies and thus a larger memory footprint. Conversely, services that are too fine-grained might lead to excessive inter-service communication overhead and a proliferation of tiny containers, each with its own baseline memory usage. Find the right balance.
- Stateless vs. Stateful: Prioritize stateless services where possible. Stateful services often require more memory for internal state management and session data. If state is necessary, consider externalizing it to dedicated data stores (e.g., Redis, Cassandra) to reduce individual container memory load.
2. Effective External Caching Strategies
Shift large, shared caches out of individual application containers to dedicated, high-performance external caching layers like Redis or Memcached. * Reduced Memory Footprint: Individual application containers become leaner, only needing to store application-specific data. * Improved Scalability: Caches can be scaled independently of the application logic. * Centralized Management: Easier to manage cache eviction policies, consistency, and monitoring.
3. Service Mesh Overheads
While service meshes (e.g., Istio, Linkerd) provide powerful traffic management, observability, and security features, they introduce a sidecar proxy container alongside each application container. This sidecar adds its own CPU and memory overhead. * Measure and Monitor: Understand the memory footprint of your chosen service mesh proxy. * Selective Deployment: Deploy the service mesh only where its features are truly needed, rather than blindly injecting it into every pod. * Configuration Tuning: Tune the proxy's configuration (e.g., reduce logging verbosity, disable unused features) to minimize its resource consumption.
APIPark is a high-performance AI gateway that allows you to securely access the most comprehensive LLM APIs globally on the APIPark platform, including OpenAI, Anthropic, Mistral, Llama2, Google Gemini, and more.Try APIPark now! 👇👇👇
Monitoring and Analysis Tools: The Eyes and Ears of Optimization
You cannot optimize what you cannot measure. A robust monitoring and analysis stack is indispensable for understanding container memory behavior, identifying anomalies, and validating optimization efforts.
1. Container Orchestrator Metrics
- Kubernetes Metrics Server: Provides basic CPU and memory usage metrics for pods and nodes. Essential for Horizontal Pod Autoscaling (HPA) and Vertical Pod Autoscaling (VPA).
- cAdvisor: (Container Advisor) Is an open-source agent that collects, aggregates, processes, and exports information about running containers. It collects resource usage (CPU, memory, network, file system) and performance characteristics. Often integrated into Kubelet.
- Prometheus and Grafana: A de-facto standard for monitoring containerized environments. Prometheus scrapes metrics (from cAdvisor, node exporter, application endpoints) and stores them, while Grafana provides powerful visualization dashboards. Create dashboards to track:
- Per-container RSS, private RSS, and working set.
- Memory request vs. limit vs. actual usage.
- OOMKill counts.
- Memory utilization trends over time.
- JVM heap usage, GC pauses (if applicable).
2. Application Performance Monitoring (APM) Tools
Dedicated APM solutions offer deeper insights into application-level memory consumption. * Datadog, New Relic, AppDynamics, Dynatrace: These tools provide detailed visibility into JVM heap, object allocations, garbage collection statistics, and can often pinpoint specific code paths responsible for high memory usage or leaks. They can correlate application metrics with infrastructure metrics. * OpenTelemetry/OpenMetrics: Implement open standards for telemetry data to ensure vendor-neutral monitoring.
3. Linux Command-Line Tools (from the host)
While not container-specific, these tools are invaluable for debugging if you have host access. * top, htop: Overview of system resource usage and processes. * free -h: Check overall system memory, swap, and cache. * ps aux --sort -rss: List processes by RSS. * pmap -x <pid>: Detailed memory map for a specific process, showing private and shared mappings. * slabtop: Monitor kernel slab cache usage.
4. Custom Metrics and Probes
Expose custom metrics from your application about its internal memory state. For example: * Cache hit rates and sizes. * Number of active connections or sessions. * Size of internal data structures. These application-specific metrics can provide context that generic container metrics cannot.
Case Study: Optimizing an API Gateway for Peak Performance
Let's consider a critical component in many modern architectures: an API gateway. An api gateway serves as the single entry point for all API calls, routing requests to appropriate microservices, handling authentication, rate limiting, and often performing request/response transformations. Due to its central role and high traffic volume, an api gateway must be exceptionally performant and memory-efficient.
Imagine an API gateway deployed in a Kubernetes cluster, built with a Java-based framework like Spring Cloud Gateway or an equivalent Go/Node.js application, processing hundreds of thousands of requests per second. Initially, the team might have provisioned it with generous memory limits (e.g., 2GB per instance) out of caution. However, monitoring reveals that while peak memory might hit 1.5GB during a massive traffic surge, the average memory usage hovers around 600-800MB. This indicates significant over-provisioning.
The Optimization Journey for an API Gateway
- Initial Assessment & Baseline:
- Deployed the gateway with default settings.
- Used Prometheus/Grafana to collect
container_memory_rss,container_memory_usage_bytes, andcontainer_memory_working_set_bytesmetrics over several days under varying loads. - Observed an average RSS of 750MB, with P99 peak at 1.2GB and occasional spikes to 1.5GB during extremely high load. OOMKills were rare but did happen during concurrent deployments and peak load.
- Application-Level Tuning (Focus on Java JVM):
- JVM Heap: The default JVM was allocating too much. Changed
JAVA_OPTSto-Xms768m -Xmx1024m(initial and max heap to 768MB and 1024MB respectively) to align with observed average usage plus a buffer. - GC Tuning: Used
-XX:+UseG1GCand fine-tunedMaxGCPauseMillisto prioritize low latency, which is critical for an api gateway. - Code Review: Identified areas of excessive object creation (e.g., creating new
Stringobjects repeatedly for logging or routing lookups instead of reusingStringBuilderor pre-calculating values). Optimized the internal routing cache to use a more memory-efficient data structure with a clear eviction policy (LRU) instead of an unboundedConcurrentHashMap.
- JVM Heap: The default JVM was allocating too much. Changed
- Container-Level Tuning:
- Base Image: Switched from
openjdk:11toopenjdk:11-jre-slim, reducing the image size by over 200MB, resulting in faster pulls and slightly less memory for filesystem cache. - Kubernetes Resource Limits: Based on the new JVM settings and application-level optimizations, adjusted
memory.requestto 800MB andmemory.limitto 1200MB. This reduced the requested memory by over 50% from the initial 2GB. - Multi-stage Build: Ensured the
Dockerfileused a multi-stage build to only include the final JAR and JRE, eliminating build-time dependencies from the final image.
- Base Image: Switched from
- Monitoring & Iteration:
- After redeploying with new settings, continuously monitored
container_memory_rssandcontainer_memory_working_set_bytes. - Observed a new average RSS of 550MB, with P99 peak at 900MB. OOMKills became virtually non-existent under typical operating conditions.
- The reduced
memory.requestallowed Kubernetes to pack more gateway instances onto existing nodes, increasing node utilization from 60% to over 85% and saving significant infrastructure costs.
- After redeploying with new settings, continuously monitored
This systematic approach transformed the API gateway from an over-provisioned, potentially unstable component into a lean, highly efficient workhorse. The average memory usage was significantly reduced, leading to better performance, higher density, and substantial cost savings.
In this context, an AI gateway product like APIPark, which boasts "Performance Rivaling Nginx" with over 20,000 TPS on an 8-core CPU and 8GB of memory, clearly benefits immensely from such meticulous container memory optimization. Achieving such high throughput on relatively modest hardware means its underlying components and services must be incredibly efficient in their memory usage. APIPark's design likely incorporates many of the strategies discussed here, ensuring its containerized instances operate with minimal overhead and maximum performance, allowing it to seamlessly manage and integrate over 100 AI models and numerous REST services. For more details on APIPark's capabilities, you can visit their official website at ApiPark. Its ability to offer features like prompt encapsulation, unified API formats, and end-to-end API lifecycle management while maintaining high performance underscores the critical importance of memory efficiency in critical infrastructure components.
Best Practices and Continuous Improvement
Memory optimization is not a destination but a journey. Maintaining an optimized environment requires continuous vigilance and adaptation.
- Establish Baselines: Document your container's average and peak memory usage under various load conditions. This baseline is crucial for future comparisons and identifying regressions.
- Automate Testing: Integrate memory profiling and regression tests into your CI/CD pipeline. Automatically detect if new code changes introduce significant memory bloat or leaks.
- Implement Alerts: Configure alerts in your monitoring system for unusual memory usage patterns:
- Memory usage consistently exceeding requests.
- Frequent OOMKills.
- Unexpected spikes in average memory usage.
- Regular Review and Tuning: Periodically review the memory profiles of your containers, especially after major code changes, new feature deployments, or changes in traffic patterns.
- Embrace Chaos Engineering (Controlled OOM Scenarios): Intentionally induce OOM conditions in non-production environments to test the resilience of your applications and their ability to recover. This helps you understand how your system behaves under memory pressure and fine-tune your OOM killer settings.
- Stay Updated: Keep your language runtimes, libraries, and container tooling (Docker, Kubernetes) updated. Newer versions often include performance improvements and memory optimizations.
- Educate Your Team: Foster a culture of memory-awareness among developers and operations teams. Encourage them to consider memory implications during design and implementation phases.
Conclusion
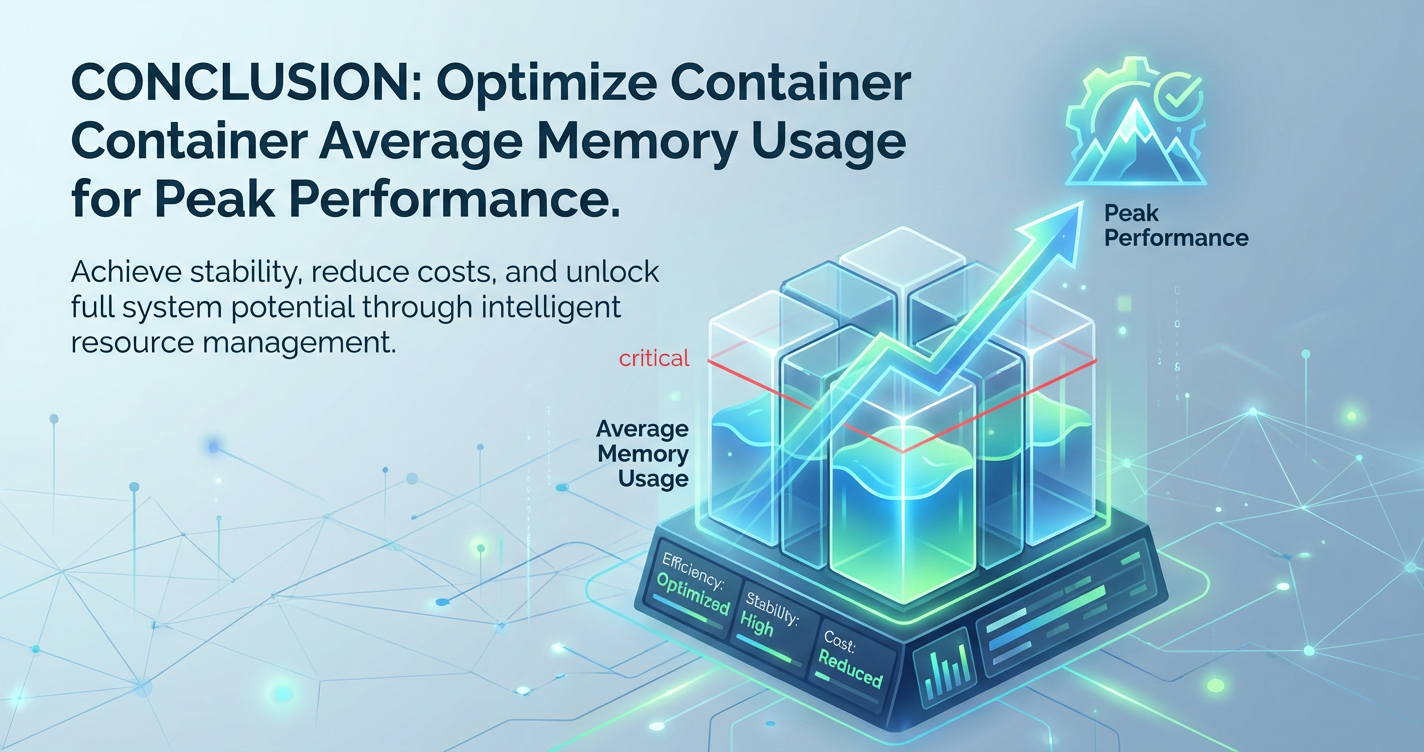
Optimizing container average memory usage is a critical discipline for anyone operating in a containerized world. It's an intricate dance between application code, runtime configurations, and infrastructure choices, all orchestrated to achieve a singular goal: peak performance with maximum efficiency. By diligently understanding container memory, proactively identifying the causes of bloat, and systematically applying a range of application-level, runtime-level, and architectural optimizations, you can transform your containerized environment.
The benefits are profound: reduced latency, higher throughput, enhanced system stability, significant cost savings, and ultimately, a more scalable and resilient platform. Whether you are running a simple microservice or managing a high-throughput api gateway like APIPark, the principles outlined in this guide provide a robust framework for unlocking the full potential of your containers. This continuous journey of measurement, analysis, and refinement ensures that your applications not only meet their performance objectives but do so with an unparalleled degree of resource efficiency, paving the way for sustainable growth and innovation.
Frequently Asked Questions (FAQs)
1. What is the difference between memory.request and memory.limit in Kubernetes, and why are both important for memory optimization? memory.request tells Kubernetes the minimum amount of memory a container needs to run. The scheduler uses this value to decide which node a pod can be placed on, ensuring that the node has enough available memory for the container's baseline needs. memory.limit sets the maximum amount of memory a container can use. If a container tries to exceed its memory.limit, the Linux kernel's OOM killer will terminate it. Both are crucial for optimization: request ensures proper scheduling and resource allocation, while limit prevents runaway memory consumption and safeguards node stability, acting as a safeguard against memory leaks or unexpected spikes. Optimizing average memory usage often means setting request close to the observed average and limit to a judiciously chosen peak value.
2. How can I effectively detect memory leaks in my containerized applications? Effective memory leak detection involves a combination of monitoring and profiling. First, monitor your container's memory usage (especially private RSS) over extended periods using tools like Prometheus/Grafana or cAdvisor. Look for continuous, unbounded growth. Second, use language-specific memory profiling tools (e.g., JProfiler for Java, pprof for Go, Chrome DevTools for Node.js, memory_profiler for Python) to take heap dumps or snapshots. Analyze these snapshots to identify objects that are accumulating over time and trace their references back to the code responsible for holding onto them. Reproduce the leak in a testing environment for easier debugging.
3. What role do base images play in container memory optimization, and which ones are recommended? The base image is the foundation of your container, and its size directly impacts the final image size and potentially the runtime memory footprint (due to filesystem caching, loaded libraries, etc.). Using a lean base image reduces image pull times, reduces attack surface, and contributes to a smaller memory footprint. Recommended lean base images include: * Alpine Linux: Extremely small, uses musl libc. Great for static binaries. * Distroless Images: From GoogleContainerTools, contain only your app and its runtime dependencies, no shell or package manager. Excellent for compiled languages. * *-slim variants: Many official language images (e.g., python:slim, openjdk:jre-slim) offer smaller versions by stripping unnecessary components.
4. How does garbage collection tuning impact container memory usage, particularly in Java? Garbage collection (GC) tuning significantly impacts memory usage in languages like Java (JVM). Default GC settings are often generous and might allocate a large heap, consuming more memory than needed for a containerized microservice. By explicitly setting the maximum heap size (-Xmx) and potentially the initial heap size (-Xms) to values closer to your container's actual requirements, you can prevent the JVM from hogging excessive memory. Choosing the right GC algorithm (e.g., G1 for balanced throughput/latency) and ensuring the JVM is aware it's running in a container (via UseContainerSupport for newer Java versions) further refines memory behavior, reducing churn and improving overall efficiency.
5. How can API Gateways benefit specifically from container memory optimization? API Gateways are critical components, handling high volumes of concurrent requests and often performing complex tasks like routing, authentication, and transformation. Memory optimization is paramount for them because: * Performance: A memory-efficient gateway can handle more requests per second (higher TPS) with lower latency, as it avoids memory thrashing and OOMKills. Products like APIPark, which emphasize high performance (e.g., 20,000 TPS on 8GB RAM), heavily rely on underlying container memory efficiency. * Stability: Due to their central role, an OOMKill in an API Gateway can bring down an entire system. Optimized memory usage makes the gateway more resilient and stable. * Cost Efficiency: Running a lean gateway allows for higher density on fewer nodes, significantly reducing infrastructure costs, which is crucial for managing large-scale API traffic. * Scalability: A predictable, optimized memory profile ensures the API gateway can scale horizontally smoothly to meet fluctuating demand without resource bottlenecks.
🚀You can securely and efficiently call the OpenAI API on APIPark in just two steps:
Step 1: Deploy the APIPark AI gateway in 5 minutes.
APIPark is developed based on Golang, offering strong product performance and low development and maintenance costs. You can deploy APIPark with a single command line.
curl -sSO https://download.apipark.com/install/quick-start.sh; bash quick-start.sh

In my experience, you can see the successful deployment interface within 5 to 10 minutes. Then, you can log in to APIPark using your account.

Step 2: Call the OpenAI API.