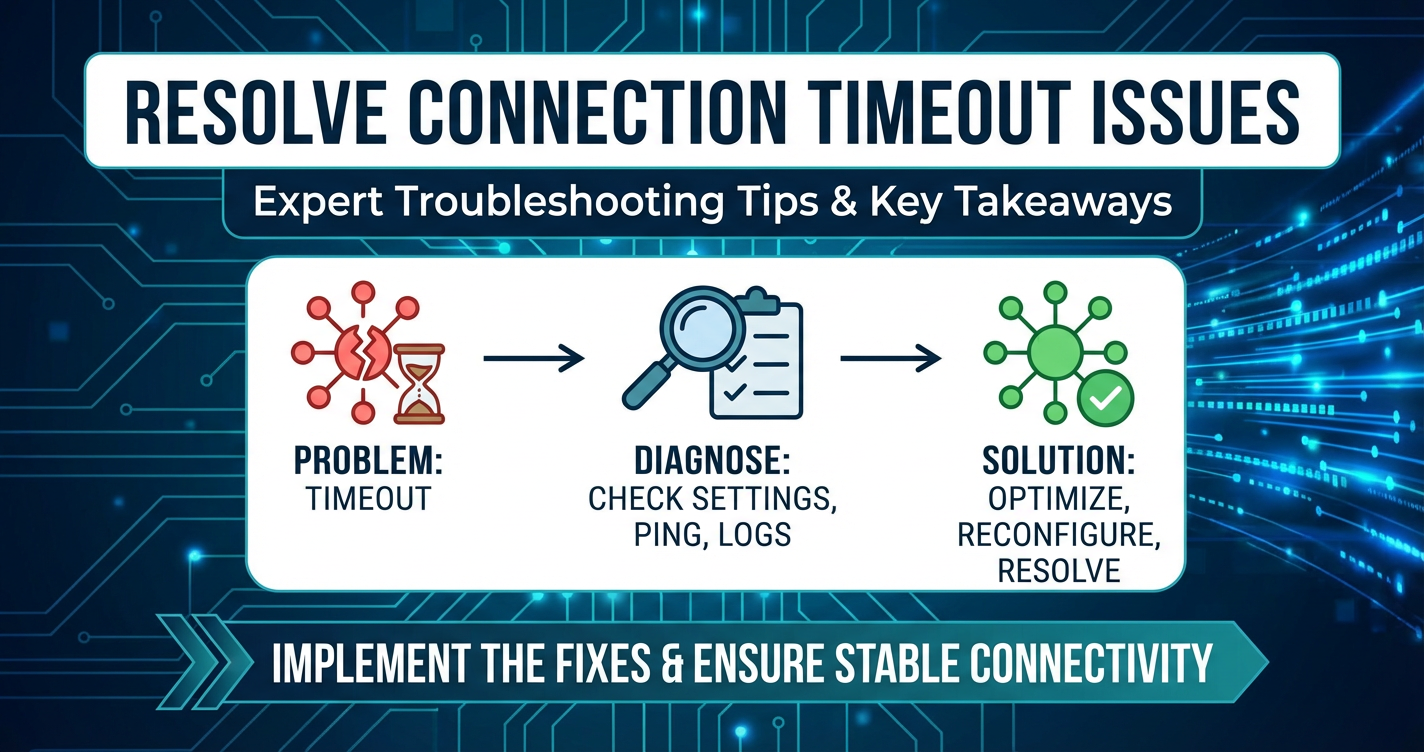
Resolve Connection Timeout Issues: Expert Troubleshooting Tips


In the complex tapestry of modern distributed systems, connection timeouts emerge as one of the most persistent and vexing challenges facing developers, system administrators, and DevOps engineers alike. These silent alarms, often manifesting as an unresponsive application or a failed service request, can halt operations, degrade user experience, and even lead to cascading system failures. A connection timeout is not merely a delay; it is a definitive refusal of a system to respond within an expected timeframe, indicating a break in the delicate ballet of inter-process communication. Understanding, diagnosing, and ultimately resolving these issues demands a meticulous, systematic approach, delving deep into the intricate layers of network infrastructure, application logic, and server configurations. This comprehensive guide will equip you with the expert knowledge and practical strategies necessary to not only troubleshoot existing connection timeouts but also to architect more resilient systems that proactively mitigate their occurrence, ensuring the smooth and reliable operation of your digital ecosystem.
The Enigma of Connection Timeouts: What They Are and Why They Occur
At its core, a connection timeout signifies that a client, be it a user's browser, a microservice, or an external system, attempted to establish a connection or receive a response from a server but failed to do so within a predefined duration. This duration, typically configured in milliseconds or seconds, acts as a sentinel, preventing indefinite waiting and resource exhaustion. When this timer expires without the expected handshake or data, the connection attempt is aborted, and an error is returned. The precise nature of this timeout can vary: it might be a network-level timeout during the TCP three-way handshake, an application-level timeout waiting for a server's response, or even a read/write timeout during data transfer.
The reasons behind these timeouts are as diverse as the systems they plague. Often, they are symptomatic of deeper underlying issues, ranging from transient network glitches to fundamental architectural flaws. Consider a common scenario: a web application attempting to retrieve data from a backend database. If the database server is overloaded, experiences a deadlock, or the network path between the application and the database is congested, the application might wait indefinitely for a response. To prevent this, a timeout is set. When the database fails to respond within this window, the application throws a connection timeout error. This seemingly simple error message can, in fact, be a red herring, pointing to a symptom rather than the root cause. Without a systematic approach, chasing down these elusive issues can quickly devolve into a frustrating and time-consuming endeavor, impacting productivity and system reliability. It is imperative to peel back the layers, understand the context, and trace the lifecycle of a request to pinpoint exactly where the communication breakdown is occurring.
The Anatomy of a Timeout: A Deeper Dive
To truly grasp the implications of a timeout, it's essential to understand the different stages where it can occur:
- TCP Connection Timeout: This is the most fundamental level. When a client initiates a TCP connection (SYN packet), it expects a SYN-ACK from the server. If this doesn't arrive within a configured timeout, often governed by the operating system's kernel parameters, the connection attempt fails. This typically points to network reachability issues, firewall blocks, or a completely unresponsive server.
- Application-Level Connection Timeout: Even if a TCP connection is established, the application itself might have a higher-level timeout for completing the entire request-response cycle. This could be waiting for an HTTP response, a database query result, or a message from a queue. These timeouts are usually configured within the application code or its framework settings.
- Read/Write Timeouts: Once a connection is established and data transfer begins, a read timeout occurs if the client doesn't receive any data (or a complete data block) within a specified period. Similarly, a write timeout occurs if the client fails to send data within its allocated time. These often indicate issues with data processing speed on the server, network buffering issues, or slow consumers/producers.
- Backend Service Timeouts: In microservices architectures, one service might call another. If a downstream service is slow or unresponsive, the upstream service will experience a timeout. This is where API gateways play a critical role in managing these inter-service communications and their respective timeout configurations.
The impact of these timeouts can be profound. From a user's perspective, it means a slow or non-functional application. For developers and operations teams, it translates to increased alert fatigue, difficult debugging sessions, and potentially significant downtime. Moreover, frequent timeouts can lead to resource contention, as clients keep retrying failed connections, exacerbating the problem and potentially overwhelming already struggling services. Therefore, mastering the art of troubleshooting connection timeouts is not just about fixing a bug; it's about safeguarding the stability and performance of your entire digital infrastructure.
The Ripple Effect: Understanding the Impact of Connection Timeouts
The seemingly innocuous "connection timeout" error message belies a cascade of potential problems that can ripple through an entire system, impacting everything from user experience to operational costs. These aren't isolated incidents; they are often indicators of underlying stress or misconfigurations that, if left unaddressed, can lead to much larger system failures. Understanding this broader impact is crucial for justifying the resources and effort required for comprehensive troubleshooting and prevention.
From the end-user's perspective, a timeout translates directly to frustration and dissatisfaction. Imagine trying to make an online purchase, only for the checkout process to hang indefinitely before finally displaying an error. Or perhaps attempting to log into a critical business application, only to be met with an unresponsive screen. Each such instance erodes trust, drives users away, and can significantly harm a brand's reputation. In an age where immediate gratification is expected, even a few seconds of delay can be enough to lose a customer or disrupt a crucial workflow. This directly affects business metrics, leading to abandoned carts, lost sales, reduced productivity, and potentially a damaged market perception.
Beyond the immediate user interaction, connection timeouts exert a heavy toll on the operational health of the system itself. They can trigger a domino effect, leading to resource exhaustion and cascading failures. When a client experiences a timeout, it often retries the connection, sometimes aggressively. If multiple clients are retrying against a struggling server, this can flood the server with requests, further increasing its load and exacerbating the original problem, creating a vicious cycle. This phenomenon is often referred to as a "thundering herd" problem. Servers can run out of available threads, memory, CPU cycles, or database connections, leading to complete service unavailability rather than just intermittent timeouts.
Furthermore, connection timeouts complicate monitoring and alerting. A system constantly throwing timeout errors generates a barrage of alerts, leading to "alert fatigue" among operations teams. This desensitization can cause genuine, critical issues to be overlooked amidst the noise. Diagnosing the true root cause becomes a nightmare, as the logs are filled with retry attempts and subsequent timeouts, obscuring the initial trigger. The time and resources spent by engineering teams on debugging these elusive problems represent a significant operational cost, diverting valuable talent from feature development and innovation.
In distributed architectures, especially those relying heavily on API communications, a timeout in one service call can block an entire transaction chain. A microservice failing to connect to its dependent API can prevent it from fulfilling its request, which in turn causes the calling service to timeout, and so on, propagating the failure throughout the system. This interdependence means that a seemingly minor timeout in a low-level component can bring down critical business functionalities. Robust API gateways become essential here, not only for routing but also for isolating failures and implementing resilience patterns.
Finally, frequent timeouts can subtly degrade system performance even when they don't lead to outright crashes. Services that are constantly timing out and retrying consume more network bandwidth, CPU cycles, and memory than they should. This inefficiencies can lead to higher infrastructure costs, as more resources are needed to handle the same workload, and can impact the overall throughput and latency of the entire platform. Resolving connection timeouts is not merely about fixing a bug; it's about optimizing resource utilization, enhancing system stability, and safeguarding the business's bottom line.
Dissecting the Battlefield: Common Scenarios and Underlying Causes
Connection timeouts are not a monolithic problem; they manifest in a myriad of scenarios, each pointing to distinct underlying causes. To effectively troubleshoot, one must first identify the context in which the timeout occurs. This section explores common scenarios where timeouts frequently arise, providing a framework for initial diagnosis.
Scenario 1: Web Services and Client-Server Communication
This is perhaps the most common scenario. A user's web browser or a mobile application attempts to fetch data or submit a form to a backend web server (e.g., Nginx, Apache, IIS) or an application server (e.g., Tomcat, Node.js, Spring Boot).
Underlying Causes: * Network Latency & Congestion: The physical or virtual network path between the client and server is slow or overloaded. This could involve internet routing issues, congested local area networks, or slow VPN connections. Packet loss here is a prime suspect. * Firewall & Security Group Blocks: A firewall (either on the client, server, or in between) is silently dropping packets, preventing the connection from being established or maintained. This is particularly common when new services are deployed or network configurations change. Security groups in cloud environments (AWS, Azure, GCP) frequently cause these issues. * DNS Resolution Issues: The client cannot resolve the server's hostname to an IP address, or it resolves to an incorrect/stale IP. This means the client literally doesn't know where to send its connection request. * Server Overload/Unresponsiveness: The server is overwhelmed with requests, has run out of available threads, memory, or CPU, and cannot accept new connections or process existing ones quickly enough. The operating system's connection queue might be full. * Application Server Configuration: The web server or application server itself has very short connection_timeout, proxy_read_timeout, or keepalive_timeout settings in its configuration (e.g., Nginx's proxy_connect_timeout). * Backend Service Dependencies: The web server/application server is waiting on a slower backend service (like a database or another API) to respond, causing it to hold open the client connection longer than expected, eventually timing out the client.
Scenario 2: Database Connections
Applications frequently connect to databases (SQL or NoSQL) to store and retrieve data. Timeouts here are particularly problematic as they often indicate data access issues.
Underlying Causes: * Long-Running Queries: A specific query is taking an excessively long time to execute due to inefficient indexing, complex joins, or large data sets. The application's database driver or ORM times out waiting for the result. * Database Server Load: The database server itself is under heavy load, experiencing high CPU utilization, I/O bottlenecks, or memory pressure, preventing it from processing queries promptly. * Connection Pool Exhaustion: The application's database connection pool has run out of available connections, and new requests are stuck waiting for a connection to become free, eventually timing out. * Network Issues to Database: Similar to web services, network latency, firewalls, or routing issues can prevent the application from connecting to or receiving data from the database. * Database Lock Contention: Row or table locks in the database prevent queries from executing, causing them to wait and eventually time out.
Scenario 3: Microservices and Internal API Calls
In modern distributed architectures, services communicate extensively via API calls. Timeouts in this context are a primary cause of cascading failures.
Underlying Causes: * Downstream Service Unavailability/Slowness: The called microservice is down, crashing, or simply too slow to respond within the caller's configured timeout. This is a common pattern in complex service graphs. * Network Mesh Configuration: Issues within the service mesh (e.g., Istio, Linkerd) or internal load balancers that distribute traffic among service instances. * Misconfigured API Gateway: The API gateway handling the routing and security between services might have overly aggressive timeouts, or it might be struggling under load itself. An API gateway needs careful configuration to balance security, performance, and resilience. For instance, platforms like APIPark offer comprehensive API lifecycle management, including robust traffic forwarding and load balancing features that are critical for preventing timeouts in microservice communications. Its ability to provide detailed API call logging and powerful data analysis can pinpoint exactly where delays occur within the service graph, transforming abstract timeout errors into actionable insights. * Resource Exhaustion in Calling Service: The calling service might be holding too many open connections or threads waiting for responses, leading to its own resource exhaustion and subsequent timeouts for its callers. * Circuit Breaker Misconfiguration: While circuit breakers are designed to prevent cascading failures, if they are configured too aggressively or with incorrect thresholds, they can prematurely trip, leading to timeouts even when the downstream service might be recovering.
Scenario 4: External API Integrations
Applications frequently integrate with third-party services via their APIs (e.g., payment gateways, messaging services, identity providers).
Underlying Causes: * Third-Party Service Issues: The external API provider is experiencing downtime, performance degradation, or rate limiting. * Network Path to External API: Internet routing issues, ISP problems, or geographically distant API servers leading to high latency. * Client-Side Integration Library Timeouts: The SDK or client library used to interact with the external API has default timeouts that are too short for the expected latency or processing time of the third-party service. * Rate Limiting: The application is exceeding the external API's rate limits, causing requests to be throttled or rejected, appearing as timeouts.
By categorizing timeouts based on these common scenarios, engineers can quickly narrow down the potential problem areas, making the troubleshooting process significantly more efficient and targeted. Each scenario points towards a specific set of tools and checks that should be prioritized.
The Investigator's Toolkit: A Systematic Troubleshooting Methodology
When confronted with a connection timeout, the natural inclination might be to randomly tweak configurations or restart services. However, this haphazard approach rarely yields sustainable solutions and often exacerbates the problem. A truly effective strategy demands a methodical, layered approach, much like a forensic investigation. This methodology systematically eliminates variables, narrows down the scope, and guides you towards the root cause with precision.
Step 1: Verify the Basics and Define the Scope
Before diving into complex diagnostics, always start with the fundamentals. Many "mysterious" timeouts are resolved by simple checks.
- Is the Service Running? It sounds trivial, but ensure the target service (web server, database, microservice) is actually started and not crashed. Use
systemctl status,docker ps, or process monitoring tools. - Can You Ping It? Test basic network reachability using
pingortraceroute(ortracerton Windows) to the target server's IP address. Ifpingfails, you have a fundamental network issue.traceroutecan identify where the network path breaks down. - Is the Port Open and Listening? Even if the server is up, the specific port the service uses might not be listening or might be blocked. Use
netstat -tulnp(Linux) orss -tulnpto check listening ports on the server. From the client, usetelnet <host> <port>ornc -vz <host> <port>to test if the port is reachable. A successfultelnetconnection means the TCP handshake completed. Iftelnethangs or fails, the port is not open or a firewall is blocking it. - DNS Resolution Check: Verify that the hostname resolves to the correct IP address using
nslookupordig. Stale DNS caches or incorrect DNS records are frequent culprits. - Scope Definition: Is the timeout happening for all clients or just one? All requests or specific ones? From inside the network or outside? This helps determine if the issue is global or localized.
Step 2: Client-Side Analysis
The client is where the timeout error is first observed. Start by examining its perspective.
- Client Logs: Review application logs on the client for detailed error messages, stack traces, or any preceding warnings. These can often provide clues about the type of timeout (connect, read, write).
- Client Configuration: Check the client's timeout settings. Many API client libraries (e.g.,
requestsin Python,HttpClientin Java/.NET) have default timeouts that might be too short for the expected server response time or network conditions. Ensure these are appropriately configured. - Client Network: Is the client itself experiencing network issues? Check its local network connectivity, Wi-Fi signal, VPN status, or local firewall settings. A proxy server misconfiguration on the client side can also cause timeouts.
- Resource Availability: Is the client machine running out of resources (CPU, memory, file descriptors)? An overloaded client might struggle to establish or maintain connections.
Step 3: Server-Side Analysis
If the client-side looks clean, the spotlight shifts to the server that is failing to respond.
- Server Logs: This is a goldmine. Check web server logs (Nginx access/error logs), application server logs (Tomcat, Node.js console), database logs, and operating system logs (syslog, journalctl). Look for errors, warnings, long-running processes, or indications of resource exhaustion at the timestamp of the timeout.
- Resource Utilization: Monitor the server's CPU, memory, disk I/O, and network I/O. Tools like
htop,top,vmstat,iostat,netstat -scan provide real-time insights. High CPU could mean expensive computations, high memory could indicate leaks, and high disk I/O could point to slow database operations. - Application Metrics: If your application exposes metrics (e.g., via Prometheus exporters), check request latency, error rates, and thread pool usage. Are there specific endpoints taking longer than usual?
- Database Performance: If the server interacts with a database, check database-specific metrics: slow query logs, active connections, lock contention, and overall database server health.
- Server Configuration: Review relevant server configurations. For web servers like Nginx, examine
worker_processes,worker_connections,keepalive_timeout,proxy_connect_timeout,proxy_read_timeout. For application servers, check thread pool sizes, maximum connections, and garbage collection pauses.
Step 4: Network & Infrastructure Layer Analysis
Often, the problem lies between the client and the server, within the network infrastructure. This layer includes routers, switches, firewalls, load balancers, and API gateways.
- Firewalls (Again): Re-verify all firewalls along the path: host-based (iptables, Windows Defender), network firewalls, and security groups in cloud environments. Check their logs for dropped packets or denied connections.
- Load Balancers: If a load balancer is in front of your servers, check its health checks, backend server status, and its own timeout configurations. An unhealthy server being marked "up" by the load balancer will cause traffic to be routed to a black hole.
- Reverse Proxies / API Gateways: If an API gateway or reverse proxy (like Nginx, HAProxy, or a dedicated API gateway product) sits between the client and the backend service, investigate its logs and configurations. Does it have appropriate
proxy_read_timeoutsettings? Is it under load? Is it correctly forwarding traffic? An advanced API gateway like APIPark provides detailed logging for every API call, which can be invaluable here. By analyzing call data, you can see exactly where the delay originated, whether it's within the gateway processing, or when forwarding to the backend, helping distinguish between a gateway issue and a backend service issue. - Packet Capture (tcpdump/Wireshark): This is the ultimate tool for network diagnostics. Capturing packets on both the client and server (or ideally, at intermediate points) allows you to see the actual network traffic. Look for:
- Missing SYN-ACKs (connection never established).
- Reset (RST) packets (connection aborted).
- Retransmissions (packet loss).
- Zero Window (receiver not processing data fast enough).
- Long gaps between packets (latency).
- This is typically used as a last resort due to its complexity and the volume of data it generates, but it provides undeniable evidence.
- MTU Issues: Mismatched Maximum Transmission Unit (MTU) sizes across different network segments can lead to packet fragmentation and reassembly issues, causing effective packet loss and timeouts. Use
ping -f -l <size>(Windows) orping -M do -s <size>(Linux) to test MTU.
Step 5: Application and API Logic Analysis
Sometimes, the timeout isn't a network or infrastructure problem, but a flaw in the application's code or its interaction with external APIs.
- External API Calls: Is your application calling a third-party API that is slow or unresponsive? Check the third-party's status page. Implement client-side timeouts for all external calls.
- Deadlocks/Resource Contention: Within the application, are there database deadlocks, thread deadlocks, or other forms of resource contention that cause requests to hang indefinitely? Profiling tools can help identify these.
- Long-Running Tasks: Is the application initiating a long-running synchronous task that blocks the request thread, causing the client to time out? Consider asynchronous processing for such tasks.
- Inefficient Code: Poorly optimized algorithms or database queries can cause execution times to exceed timeout limits, especially under load.
- Connection Pooling Misconfiguration: For applications using database or HTTP connection pools, misconfigured
max_idle_time,max_lifetime, ormaximum_pool_sizecan lead to connection exhaustion or stale connections that fail.
By meticulously working through these steps, starting from the broadest checks and progressively narrowing down the focus, you can effectively diagnose and pinpoint the exact source of connection timeouts, moving from symptoms to the true underlying cause. This systematic approach saves time, reduces frustration, and ultimately leads to more robust and reliable systems.
APIPark is a high-performance AI gateway that allows you to securely access the most comprehensive LLM APIs globally on the APIPark platform, including OpenAI, Anthropic, Mistral, Llama2, Google Gemini, and more.Try APIPark now! 👇👇👇
Advanced Diagnostic Techniques and Tools
While the systematic methodology covers most common scenarios, some elusive connection timeouts demand a more sophisticated approach. Leveraging advanced diagnostic tools and techniques can provide deeper insights into system behavior, network interactions, and application performance, helping to uncover the root causes that are hidden from basic observation.
1. Centralized Logging and Log Analysis
Modern distributed systems generate an immense volume of logs. Relying solely on local log files on individual servers is inefficient and impractical.
- ELK Stack (Elasticsearch, Logstash, Kibana), Splunk, Graylog: Implement a centralized logging solution. This aggregates logs from all services, servers, and network devices into a single, searchable platform.
- How it helps: When a timeout occurs, you can search across all logs for the specific
request_idorcorrelation_id(if implemented) across all relevant services. This allows you to reconstruct the entire transaction flow and identify exactly which service took too long to respond, or where an error originated upstream. - Focus Areas: Look for warning or error messages immediately preceding the timeout on the server that should have responded. Pay attention to timestamps and latency metrics within the logs. For instance, an API gateway like APIPark provides comprehensive logging for every API call, detailing request and response times, status codes, and other metadata. This granular data, when centralized, offers an unparalleled view into the performance characteristics of individual API calls, enabling quick identification of slow segments within a complex transaction flow.
- How it helps: When a timeout occurs, you can search across all logs for the specific
2. Monitoring and Alerting Systems
Proactive monitoring is paramount. It allows you to identify performance degradation before it leads to widespread timeouts.
- Prometheus + Grafana: A popular open-source stack for time-series monitoring.
- How it helps: Monitor key metrics like:
- CPU, Memory, Disk I/O, Network I/O: High utilization can indicate resource bottlenecks.
- Request Latency: Track average, p95, p99 latency for critical API endpoints. Spikes in latency are often precursors to timeouts.
- Error Rates: An increase in 5xx errors or specific timeout error codes.
- Connection Counts: Number of open connections to databases, other services, or the web server itself. High connection counts can lead to exhaustion.
- Queue Lengths: Check internal queues for messages or requests waiting to be processed.
- Alerting: Configure alerts for deviations from baselines (e.g., latency exceeding X ms for Y minutes, error rate above Z%). This notifies you immediately when problems arise.
- How it helps: Monitor key metrics like:
- Application Performance Monitoring (APM) Tools (New Relic, Datadog, AppDynamics): These commercial tools offer deep insights into application code execution, database queries, and distributed transaction tracing.
- How it helps: APM tools can identify bottlenecks within your application code, pinpoint slow database queries, and visualize the call stack across multiple services, providing a clear path to the source of delays that cause timeouts.
3. Distributed Tracing
In microservices architectures, a single user request can traverse dozens of services. Traditional logging struggles to connect these disparate log entries.
- Jaeger, Zipkin, OpenTelemetry: These tools implement distributed tracing, allowing you to visualize the end-to-end flow of a request across multiple services.
- How it helps: Each service in the call chain adds its own "span" to a trace. When a timeout occurs, the trace will show exactly which service's span took an exceptionally long time, or which service failed to respond altogether. This eliminates guesswork and dramatically reduces debugging time in complex distributed systems. You can see the duration of each internal API call, external API call, and database query within the context of the larger request.
4. Packet Capture and Analysis (Deep Dive)
As mentioned before, tcpdump (Linux/macOS) and Wireshark (GUI for packet analysis) are indispensable for network-level diagnostics.
- Advanced Usage: Don't just look for SYN-ACKs. Analyze TCP flags, sequence numbers, and window sizes.
- Retransmissions: Frequent TCP retransmissions indicate packet loss, often due to network congestion, faulty hardware, or overloaded network interfaces.
- Zero Window: If a server advertises a "Zero Window" size, it means its receive buffer is full, and it cannot accept more data. This indicates a processing bottleneck on the server side, not a network issue.
- High RTT (Round Trip Time): Long delays between SYN and SYN-ACK, or between subsequent data packets, signify high network latency.
- TCP RST (Reset) packets: A
RSTpacket immediately terminates a connection. If the client receivesRSTshortly afterSYN, it often means the port is closed or a firewall rejected the connection. If the server sendsRSTmid-connection, it could be due to an application crash or an explicit refusal.
- Strategic Placement: Capture packets at various points: the client, the API gateway, the load balancer, and the target server. Comparing these captures can pinpoint the exact network segment where the packets are being lost or delayed.
5. Stress Testing and Performance Profiling
Sometimes, timeouts only appear under specific load conditions.
- Load Testing Tools (JMeter, k6, Locust, Gatling): Simulate high user traffic to identify breaking points and observe how your system behaves under stress.
- How it helps: Load testing can predictably reproduce timeouts, allowing you to troubleshoot them in a controlled environment. Observe metrics during load tests to correlate resource spikes with timeout occurrences.
- Profiling Tools (YourKit, JProfiler, perf, pprof): These tools analyze the execution of your application code, identifying CPU hotspots, memory leaks, and lock contention.
- How it helps: If a service consistently times out under load, profiling can reveal inefficient algorithms, excessive garbage collection, or database access patterns that are consuming too much time and resources, leading to the application's inability to respond promptly.
By integrating these advanced techniques and tools into your troubleshooting arsenal, you can move beyond reactive problem-solving to proactive identification and resolution, building a more resilient and performant system capable of handling the demands of modern digital operations.
Layer-Specific Deep Dives: Addressing Timeouts at Each Level
Effective troubleshooting requires understanding the nuances of each layer within your infrastructure. A timeout might originate from the network, the operating system, the application server, the database, or the intricate web of microservices and API interactions. Addressing the problem at its specific layer often requires distinct knowledge and configuration adjustments.
1. Network Layer: The Foundation of Connectivity
The network is the circulatory system of any distributed application. Problems here are fundamental.
- MTU Mismatch: As mentioned, a common yet often overlooked issue. Different Maximum Transmission Unit (MTU) sizes across routers can lead to packet fragmentation. If a packet is too large for a segment and marked "Don't Fragment" (DF), it's dropped. This silently causes packet loss and retransmissions, leading to timeouts.
- Resolution: Use
pingwith theDFflag and varying packet sizes to discover the optimal MTU along the path (ping -M do -s <size> <destination>on Linux). Ensure consistent MTU settings, especially in VPNs or cloud network overlays.
- Resolution: Use
- Network Congestion & Bandwidth Exhaustion: Too much traffic on a shared link, or insufficient bandwidth for the workload, results in packet queuing and delays.
- Resolution: Monitor network interface utilization (e.g.,
sar -n DEV,iftop). Implement QoS (Quality of Service) policies if possible. Upgrade network links or consider traffic shaping.
- Resolution: Monitor network interface utilization (e.g.,
- Routing Issues: Incorrect routing tables can send traffic down a black hole or a suboptimal path, leading to increased latency or outright loss.
- Resolution: Use
tracerouteormtr(My Traceroute) to diagnose the path. Verify routing table entries (ip route show).
- Resolution: Use
- Load Balancer Configuration: Load balancers often have their own timeouts (e.g., idle timeout, backend connection timeout). If these are shorter than the application's expected processing time, the load balancer might prematurely close the connection.
- Resolution: Align load balancer timeouts with your application's expected maximum processing time. Ensure health checks are correctly configured to remove unhealthy backend instances from the rotation.
2. Operating System Layer: The Beneath the Surface
The underlying operating system plays a critical role in managing network connections and resources.
- File Descriptor Limits: Every open socket, file, or pipe consumes a file descriptor. If an application or the OS runs out of available file descriptors, it cannot establish new connections, leading to "Too many open files" errors and connection timeouts.
- Resolution: Increase the ulimit for file descriptors (
ulimit -n <number>) for the user running the application and in/etc/sysctl.conf(fs.file-max).
- Resolution: Increase the ulimit for file descriptors (
- TCP Socket Buffer Sizes: Inadequate TCP send/receive buffer sizes can throttle network throughput, especially over high-latency links.
- Resolution: Adjust kernel parameters in
/etc/sysctl.conf:net.core.wmem_default,net.core.rmem_default,net.core.wmem_max,net.core.rmem_max. These need careful tuning based on network characteristics.
- Resolution: Adjust kernel parameters in
- Ephemeral Port Exhaustion: When a client initiates many outbound connections, it uses ephemeral ports. If it rapidly opens and closes connections without proper cleanup, it can exhaust the available ephemeral port range, preventing new outbound connections.
- Resolution: Increase the ephemeral port range (
net.ipv4.ip_local_port_rangeinsysctl.conf) and decrease theTIME_WAITstate duration (net.ipv4.tcp_fin_timeout,net.ipv4.tcp_tw_reuse).
- Resolution: Increase the ephemeral port range (
- Network Stack Configuration: Parameters like
net.ipv4.tcp_syn_retries(number of times the kernel will retransmit a SYN packet) andnet.ipv4.tcp_max_syn_backlog(size of the SYN queue for incoming connections) are critical. Iftcp_max_syn_backlogis too small on a busy server, legitimate SYN requests might be dropped, causing client timeouts.- Resolution: Adjust these
sysctlparameters to match your expected load.
- Resolution: Adjust these
3. Web Server / Application Server Layer: The Application's Gateway
These servers are the first point of contact for many requests and are highly configurable.
- Nginx Configuration:
proxy_connect_timeout: Time to establish a connection with the backend. If too low, you'll see "connection refused" or "host unreachable" from Nginx.proxy_read_timeout: Time for Nginx to wait for a response from the backend. If the backend is slow, Nginx will timeout the connection to the client.keepalive_timeout: How long a keep-alive connection will stay open. If too short, clients will frequently re-establish connections, adding overhead.worker_connections: Max number of simultaneous connections a worker process can handle. Insufficient value leads to "too many open files" or connection refusal errors from Nginx.- Resolution: Systematically increase these values, starting with
proxy_read_timeout, until timeouts subside, always balancing responsiveness with resource usage.
- Apache HTTPD:
Timeout: General timeout for receiving data on an established connection.KeepAliveTimeout: How long to wait for the next request on a persistent connection.MaxRequestWorkers: Max concurrent client requests. Exhaustion leads to queueing and timeouts.- Resolution: Adjust similarly to Nginx, focusing on
TimeoutandMaxRequestWorkers.
- Node.js / Java (e.g., Tomcat, Spring Boot):
- Thread Pool Exhaustion: Application servers typically use thread pools to handle incoming requests. If all threads are busy (e.g., waiting on slow database queries or external APIs), new requests will queue up and eventually time out.
- Resolution: Increase thread pool sizes (e.g., Tomcat's
maxThreads, Spring Boot'sserver.tomcat.max-threads). However, a better solution is to identify and optimize the blocking operations or introduce asynchronous processing. - JVM Memory Issues: Frequent or long garbage collection pauses can make a Java application unresponsive, leading to client timeouts.
- Resolution: Tune JVM heap size, garbage collector type, and initial/max heap settings. Monitor GC logs.
4. Database Layer: The Heart of Data
Database performance is often a major bottleneck causing timeouts.
- Long-Running Queries: Inefficient SQL queries are a prime suspect.
- Resolution: Use
EXPLAIN ANALYZE(PostgreSQL),EXPLAIN EXTENDED(MySQL) to analyze query plans. Add appropriate indexes. Refactor queries.
- Resolution: Use
- Database Locks: Row or table locks can prevent other transactions from proceeding.
- Resolution: Identify blocking queries (
pg_stat_activityin PostgreSQL,SHOW PROCESSLISTin MySQL,sys.dm_tran_locksin SQL Server). Optimize transaction boundaries, use pessimistic vs. optimistic locking appropriately.
- Resolution: Identify blocking queries (
- Connection Pool Configuration: The application's connection pool to the database must be correctly sized. Too small, and requests queue up; too large, and it overwhelms the database.
- Resolution: Tune
maximumPoolSize,minimumIdle,connectionTimeout(client-side connection acquisition timeout), andmaxLifetime(how long a connection can live in the pool) for libraries like HikariCP or c3p0. AlignconnectionTimeoutwith the database'swait_timeoutor similar parameters.
- Resolution: Tune
- Database Server Resources: Just like application servers, database servers can suffer from CPU, memory, or I/O exhaustion.
- Resolution: Monitor these resources using database-specific tools. Scale up the database server, optimize disk I/O, or shard the database.
5. Microservices and API Gateway Layer: Orchestrating Complexity
In a microservices world, API gateways become critical chokepoints and points of control.
- Circuit Breakers: These patterns (e.g., Hystrix, Resilience4j) are vital for preventing cascading failures. If a downstream service is struggling, the circuit breaker opens, failing fast instead of waiting for a timeout.
- Resolution: Ensure circuit breakers are implemented with appropriate thresholds (failure rate, call volume) and reset times. If a timeout is occurring, check if the circuit breaker is correctly configured for the downstream service.
- Retry Mechanisms: Clients often retry failed requests.
- Resolution: Implement intelligent retry strategies with exponential backoff and jitter to avoid overwhelming a recovering service. Distinguish between idempotent and non-idempotent operations.
- Rate Limiting and Throttling: Prevent a single client or service from overwhelming a downstream API.
- Resolution: Implement rate limits at the API gateway level or within services. When a service is rate-limited, it should return a 429 status code, allowing the client to back off, rather than letting the connection hang and time out.
- *API Gateway* Configuration: As the central point for API traffic, the API gateway's own timeouts are paramount.
- Resolution: For products like APIPark, examine
proxy_read_timeout,proxy_connect_timeout, and any service-specific timeout configurations. Ensure the gateway's performance is adequate for the expected traffic volume. APIPark's ability to support cluster deployment and achieve high TPS rates (over 20,000 TPS on an 8-core CPU, 8GB memory) is designed precisely to prevent the gateway itself from becoming a bottleneck and causing timeouts. Its end-to-end API lifecycle management ensures that traffic forwarding, load balancing, and versioning are regulated, directly contributing to preventing connection timeouts.
- Resolution: For products like APIPark, examine
- Service Mesh Sidecars: In a service mesh, sidecar proxies (e.g., Envoy) introduce another layer where timeouts can occur.
- Resolution: Check sidecar configuration for request timeouts, retry policies, and connection pool settings for upstream clusters. Review proxy logs.
By systematically addressing issues at each of these layers, engineers can dismantle the complex problem of connection timeouts into manageable, actionable steps, leading to more robust, reliable, and performant systems. This layered approach ensures that the solution is precisely targeted at the root cause, rather than merely treating the symptoms.
Building Resilience: Preventative Measures and Best Practices
Resolving existing connection timeouts is a reactive measure. True mastery lies in preventing them from occurring in the first place. By adopting a proactive mindset and implementing robust architectural patterns and best practices, you can build systems that are inherently more resilient to transient failures and gracefully handle adverse conditions, significantly reducing the frequency and impact of connection timeouts.
1. Implement Thoughtful Timeouts and Retries
This is fundamental. Don't rely on infinite waits.
- Client-Side Timeouts: Every external call your application makes – to databases, other microservices, or third-party APIs – must have a defined timeout.
- Strategy: Configure connect timeouts (how long to establish a connection) and read/write timeouts (how long to wait for data on an established connection). These should be slightly longer than the expected average response time but short enough to prevent indefinite hangs.
- Server-Side Timeouts: Ensure your web servers, API gateways, and application servers have appropriate timeouts for communicating with their backends.
- Intelligent Retry Mechanisms:
- Exponential Backoff: If a request fails, don't retry immediately. Wait for a short period, then retry. If it fails again, wait for a longer period, and so on (e.g., 1s, 2s, 4s, 8s). This prevents overwhelming a struggling service.
- Jitter: Add a small random delay to the backoff time to avoid all retries from multiple clients hitting the server simultaneously.
- Retry on Idempotent Operations Only: Only retry operations that can be safely executed multiple times without adverse effects (e.g., reading data). Avoid retrying non-idempotent operations (e.g., creating a new order) unless your system can handle duplicates.
- Maximum Retries: Define a maximum number of retries before giving up and failing the operation.
2. Embrace Circuit Breakers and Bulkheads
These resilience patterns are crucial in distributed systems.
- Circuit Breakers: Instead of constantly trying to connect to a failing service (which contributes to timeouts and resource exhaustion), a circuit breaker pattern (e.g., Hystrix, Resilience4j) "trips" open after a certain number of failures, quickly failing subsequent requests without attempting to connect. After a configurable "sleep window," it tries a single request to see if the service has recovered, then closes the circuit if successful.
- Benefit: Prevents cascading failures, gives the failing service time to recover, and saves resources on the client side.
- Bulkheads: Isolate components to prevent a failure in one from sinking the entire system. Imagine compartments in a ship. If one compartment floods, the others remain dry.
- Strategy: Use separate thread pools, connection pools, or even dedicated processes for different downstream services. If one service becomes slow, its dedicated resources get exhausted, but other services can continue to function using their own isolated resources.
3. Implement Robust Load Balancing and Auto-Scaling
Distribute traffic intelligently and scale resources dynamically.
- Effective Load Balancing: Use a sophisticated load balancer (L4/L7) to distribute incoming requests across multiple instances of your service.
- Benefit: Prevents any single instance from becoming overloaded and timing out.
- Health Checks: Configure aggressive and accurate health checks so the load balancer can quickly remove unhealthy instances from the rotation and stop sending them traffic.
- Auto-Scaling: Automatically adjust the number of service instances based on demand (e.g., CPU utilization, request queue depth).
- Benefit: Ensures that sufficient resources are always available to handle the current workload, preventing services from becoming overwhelmed and timing out during traffic spikes.
4. Optimize Connection Pooling
Managing connections efficiently is vital, especially for databases and external APIs.
- Database Connection Pools: Configure pools with appropriate
maximumPoolSize,minimumIdle,connectionTimeout, andmaxLifetimesettings.- Benefit: Reuses existing connections, reducing the overhead of establishing new ones. Prevents database connection exhaustion.
- HTTP Connection Pools: For outbound API calls, use HTTP client libraries with connection pooling.
- Benefit: Similar to database pools, this reuses TCP connections, reducing latency and resource usage.
5. Prioritize Asynchronous Processing and Non-Blocking I/O
Avoid synchronous blocking operations wherever possible.
- Asynchronous Tasks: For long-running operations (e.g., sending emails, processing large files, complex reports), offload them to asynchronous worker queues (e.g., Kafka, RabbitMQ, SQS) rather than performing them synchronously within the request-response cycle.
- Benefit: Frees up the request thread quickly, allowing the client to receive a response promptly (e.g., "request accepted for processing") and preventing timeouts.
- Non-Blocking I/O: Use non-blocking I/O frameworks (e.g., Node.js, Netty, Vert.x) for network operations.
- Benefit: A single thread can handle many concurrent connections without blocking, improving scalability and responsiveness.
6. Comprehensive Monitoring, Alerting, and Logging
Visibility is your best defense against unexpected timeouts.
- Granular Metrics: Monitor all critical system metrics (CPU, memory, network, disk I/O), application-specific metrics (request latency, error rates, queue lengths, thread pool usage), and business metrics.
- Proactive Alerting: Set up alerts for anomalies in these metrics (e.g., P99 latency exceeding a threshold, sudden increase in error rates, resource utilization spikes). This allows you to intervene before timeouts become widespread.
- Centralized Logging: Aggregate logs from all components (services, API gateways, databases, load balancers) into a central system.
- Benefit: Facilitates rapid diagnosis by providing a holistic view of system behavior and transaction flows. For instance, APIPark provides powerful data analysis on historical call data to display long-term trends and performance changes. This predictive capability helps businesses with preventive maintenance, identifying potential bottlenecks and addressing them before they manifest as critical connection timeouts. The platform's detailed API call logging further ensures every detail of each API call is recorded, making tracing and troubleshooting significantly more efficient.
7. Implement API Gateway for Resilience and Management
A well-configured API gateway is not just a routing layer; it's a critical component for building resilient systems.
- Traffic Management: Utilize the API gateway for features like request routing, load balancing to backend services, rate limiting, and throttling.
- Centralized Timeout Configuration: Manage timeouts for upstream and downstream services at a central point, ensuring consistency.
- Security and Authentication: Protect your backend services from malicious or overwhelming traffic.
- Observability: Leverage the API gateway's logging and monitoring capabilities to gain insights into API performance and identify potential timeout hotspots.
- Example: Solutions like APIPark are designed as open-source AI gateways and API management platforms that offer end-to-end API lifecycle management. This includes regulating traffic forwarding, load balancing, and versioning of published APIs, all of which directly contribute to preventing and managing connection timeouts. By standardizing API invocation formats and providing quick integration of numerous AI models, APIPark inherently simplifies the complexity that can lead to misconfigurations and, subsequently, timeouts. Its robust performance, rivaling Nginx, ensures that the gateway itself does not become a source of timeouts, even under heavy loads.
By diligently implementing these preventative measures and architectural best practices, organizations can move from a reactive firefighting mode to a proactive stance, building systems that are robust, self-healing, and capable of maintaining high availability and performance even in the face of transient failures and unexpected loads. This strategic investment in resilience pays dividends in terms of reduced downtime, improved user satisfaction, and increased operational efficiency.
Case Studies and Practical Examples
To solidify the theoretical concepts, let's explore a few hypothetical scenarios where connection timeouts arise and how the systematic troubleshooting methodology would apply, coupled with preventative measures.
Case Study 1: E-commerce Checkout Freezes
Scenario: Users sporadically report that their checkout process on an e-commerce website hangs indefinitely after clicking "Place Order," eventually displaying a "Connection Timeout" error. This seems to happen more frequently during peak sale periods.
Initial Symptom & Scope: Client-side timeout during an POST /checkout/place-order API call. Affects multiple users, especially under load.
Troubleshooting Steps:
- Verify Basics:
pingthe web server, database, and payment API. All reachable.telnetto relevant ports. All open.- Web server and application services running.
- Client-Side: Browser developer console shows the
POSTrequest to/checkout/place-orderpending for a long time, then a504 Gateway Timeoutor500 Internal Server Error(depending on proxy configuration). - Server-Side (Web Server & Application):
- Nginx logs: Show
504 Gateway Timeouterrors, indicating Nginx timed out waiting for the upstream application server. - Application server logs (Spring Boot): No immediate errors related to "timeout" for the
/checkout/place-orderendpoint, but logs show increasing latency for specific database queries or calls to the external payment API. - Resource Monitoring (Application Server): During peak times, CPU utilization is high, and thread pool usage approaches its limit.
- Database (PostgreSQL) Logs/Metrics: Slow query logs show that the
INSERToperation into theorderstable, which also updatesinventory, is sometimes taking 5-10 seconds due to lock contention on theinventorytable. Also, calls to the external payment gateway sometimes take 3-5 seconds.
- Nginx logs: Show
- Network/Infrastructure:
- Load Balancer: Its idle timeout is 60 seconds. Nginx
proxy_read_timeoutis 30 seconds. Application server default servlet timeout is 60 seconds. - The Nginx
proxy_read_timeout(30s) is shorter than the application's potential wait time (DB lock + payment gateway = up to 15s+). This means Nginx is timing out before the application has a chance to fully process the request or its own application-level timeout.
- Load Balancer: Its idle timeout is 60 seconds. Nginx
- Application Logic: The
/checkout/place-orderendpoint performs several synchronous operations:- Validate cart (DB read)
- Create order record (DB insert)
- Update inventory (DB update - source of contention)
- Call external payment API (slow)
- Send confirmation email (another external call)
Diagnosis: The Nginx proxy_read_timeout (30s) is too aggressive for operations that can occasionally exceed this, particularly under load due to database lock contention and slow external API calls. The application's synchronous nature for these critical steps exacerbates the problem, leading to thread pool exhaustion and further delays.
Resolution & Preventative Measures:
- Immediate Fix: Increase Nginx
proxy_read_timeoutto 60 seconds to match the application's maximum expected processing time during peak. - Database Optimization: Optimize
inventoryupdate queries, ensuring proper indexing. Consider transactional isolation levels or optimistic locking to reduce contention. - Asynchronous Processing: Refactor the checkout process:
- Place Order: Immediately create a pending order, respond to the client with an order ID, and dispatch the payment processing and inventory update to a message queue.
- Payment Processing: A separate worker consumes from the queue, calls the external payment API, and updates order status.
- Inventory Update: Another worker updates inventory.
- Email: Sent asynchronously.
- External API Resilience: Implement client-side timeouts and retries with exponential backoff for the payment API call. Consider a circuit breaker pattern for the payment API to fail fast if it's consistently unresponsive.
- APIPark Integration: If an API gateway like APIPark were used, it could centrally manage
proxy_read_timeoutfor the checkout API endpoint. Its detailed call logging would immediately highlight the slowPOST /checkout/place-orderrequest and its downstream dependencies (database, payment API) for rapid diagnosis. Its advanced data analysis could show trends in payment gateway latency, allowing proactive adjustments.
Case Study 2: Microservice API Call Fails Sporadically
Scenario: A User-Service calls an Order-Service API to retrieve a user's recent orders. Sometimes, the User-Service reports a "Connection Timeout" when trying to communicate with the Order-Service, especially after deployments or scaling events.
Initial Symptom & Scope: User-Service to Order-Service API call timeout. Sporadic, often after infrastructure changes.
Troubleshooting Steps:
- Verify Basics:
Order-Serviceinstances are running and healthy (checked via orchestrator like Kubernetes).pingandtelnetfromUser-Servicecontainer toOrder-Servicecontainer IP/port: sometimes works, sometimes hangs. This immediately points to an intermittent network issue or service availability.
- Client-Side (
User-Service):- Logs show
ConnectionTimeoutExceptionforOrder-ServiceAPI endpoint. - Client HTTP library (e.g., FeignClient in Spring Cloud) has a default connect timeout of 1 second, and read timeout of 5 seconds.
- Logs show
- Server-Side (
Order-Service):- Logs show
Order-Serviceis generally responsive. No high CPU/memory during timeouts. - Occasional
java.net.BindException: Address already in useor "Too many open files" errors are found in theOrder-Servicelogs after scaling down instances and then scaling up again.
- Logs show
- Network/Infrastructure (
API Gateway/ Service Mesh / K8s Networking):- The services are deployed in Kubernetes, with a service mesh (e.g., Istio) and an internal API gateway (which could be APIPark) managing inter-service communication.
- Kubernetes Events: Check for pod eviction, frequent restarts, or issues with network policies affecting
Order-Servicepods. - Service Mesh Logs: Envoy proxy logs (if Istio is used) on the
Order-Servicepods show occasional failures to bind to ports or ephemeral port exhaustion, especially after rapid restarts. sysctl.confon K8s Nodes: Checknet.ipv4.ip_local_port_rangeandnet.ipv4.tcp_fin_timeout. They are at default, relatively low values.
Diagnosis: The Order-Service pods, especially after scaling changes or restarts, are occasionally struggling with ephemeral port exhaustion or TIME_WAIT state issues, preventing them from opening new sockets quickly enough to accept connections. The client's (User-Service) 1-second connect timeout is too aggressive for these transient network hiccups.
Resolution & Preventative Measures:
- OS Tuning on K8s Nodes: Increase
net.ipv4.ip_local_port_rangeand decreasenet.ipv4.tcp_fin_timeout(e.g., to 30s) on all Kubernetes worker nodes viasysctl.confto alleviate ephemeral port exhaustion and rapidly reclaimTIME_WAITsockets. - Client-Side Timeout Adjustment: Increase
User-Service's connect timeout toOrder-Serviceto 3 seconds. - Intelligent Retries: Implement exponential backoff with jitter for
User-Servicecalls toOrder-Service. - Service Mesh/APIPark Configuration: Configure the API gateway (e.g., APIPark or Istio Gateway) with more tolerant connect and read timeouts for internal service-to-service communication. APIPark's end-to-end API lifecycle management would enforce consistent timeouts and retry policies for all internal API calls, preventing individual services from being misconfigured. Its performance monitoring and detailed logging would swiftly highlight the
Order-Serviceas the source of intermittent connection failures. - Readiness Probes: Ensure
Order-Servicehas robust Kubernetes readiness probes that genuinely check if the service is ready to accept connections and process requests, not just if the process is running. This prevents traffic from being routed to unready pods.
These case studies highlight that connection timeouts are rarely simple. They require a holistic understanding of the system, leveraging a systematic approach, and deploying both immediate fixes and long-term preventative measures to ensure system stability and performance.
Conclusion: Mastering the Art of Resilient Systems
Connection timeouts, while often perceived as frustrating technical glitches, are, in essence, invaluable diagnostic signals. They are the system's way of crying for help, indicating stress points, misconfigurations, or architectural weaknesses that, if left unaddressed, can spiral into catastrophic failures. Mastering the art of resolving these issues goes beyond merely debugging; it encompasses a deep understanding of network protocols, operating system intricacies, application behavior, and the complex interplay within distributed architectures.
The journey begins with a meticulous, systematic troubleshooting methodology, starting with fundamental checks and progressively delving into client, server, and network layers. Leveraging advanced diagnostic tools—from centralized logging and comprehensive monitoring to distributed tracing and granular packet analysis—provides the necessary visibility to pinpoint the elusive root causes. Whether the culprit lies in an overburdened database, a misconfigured API gateway, an overloaded network link, or a deadlock within application logic, each layer demands specific attention and tailored solutions.
Crucially, the ultimate goal is to transcend reactive problem-solving and embrace a proactive posture. By implementing robust preventative measures, such as intelligently configured timeouts and retry mechanisms, resilient patterns like circuit breakers and bulkheads, dynamic load balancing and auto-scaling, and efficient connection pooling, systems can be engineered to be inherently more robust. An effective API gateway, such as APIPark, plays a pivotal role in this endeavor, providing centralized management for API lifecycle, traffic control, and crucial observability features that help prevent and diagnose timeouts across an entire ecosystem. Its ability to provide detailed call logging and powerful data analysis equips engineers with the foresight to anticipate and mitigate issues before they impact users.
In the ever-evolving landscape of cloud-native and microservices-driven applications, where interactions are increasingly complex and interdependent, the capacity to efficiently diagnose and prevent connection timeouts is not merely a technical skill—it is a strategic imperative. By cultivating this expertise, organizations can build systems that are not only performant and scalable but also resilient, reliable, and ultimately, trusted by their users, safeguarding business continuity and fostering innovation in the digital age.
Frequently Asked Questions (FAQ)
1. What is the fundamental difference between a "connection timeout" and a "read timeout"?
A connection timeout occurs when a client fails to establish a connection with a server within a specified time. This typically happens during the initial TCP handshake (SYN, SYN-ACK). It means the client couldn't even "knock on the door" or the server didn't respond to the knock. A read timeout, on the other hand, occurs after a connection has been successfully established and data transfer has begun. It means the client was waiting for data (a response, or a part of a response) from the server but didn't receive anything within the set timeframe. This often indicates the server is processing the request very slowly, is blocked, or the network is experiencing severe packet loss during an active transfer.
2. How can I differentiate between a network issue and a server performance issue when a timeout occurs?
Start by using network diagnostic tools like ping and telnet (or nc) from the client to the server's IP and port. If ping fails or shows high latency, it's likely a network issue. If telnet <host> <port> hangs or fails to connect, it strongly points to a network block (firewall) or the server not listening on that port. If telnet connects successfully, but the application still times out, it suggests the network path is open, and the problem is more likely on the server (application performance, resource exhaustion, database locks) or with an API gateway upstream of the server. Further server-side monitoring (CPU, memory, logs) will confirm application performance issues. Using traceroute can pinpoint where network latency is introduced.
3. What role does an API gateway play in managing and preventing connection timeouts?
An API gateway acts as a central entry point for all API calls, both internal and external. It can be instrumental in managing timeouts by: 1. Centralized Configuration: Setting consistent connect and read timeouts for various upstream services. 2. Load Balancing: Distributing requests across multiple backend service instances to prevent any single one from being overloaded. 3. Traffic Management: Implementing rate limiting and throttling to protect backend services from excessive requests that could lead to timeouts. 4. Circuit Breaking: Implementing circuit breakers to prevent cascading failures by quickly failing requests to unhealthy services. 5. Monitoring & Logging: Providing detailed logs and metrics for API calls, allowing quick identification of services causing delays. For instance, platforms like APIPark offer comprehensive API management features, including robust traffic forwarding, load balancing, and detailed API call logging, specifically designed to help prevent and diagnose connection timeouts effectively.
4. Why are retries with exponential backoff and jitter considered a best practice for handling timeouts?
Exponential backoff means that after each failed retry attempt, the waiting period before the next retry increases exponentially (e.g., 1s, 2s, 4s, 8s). This is crucial because it gives a struggling server more time to recover without being overwhelmed by a flood of immediate retries. Jitter involves adding a small, random delay to each backoff period. This is important to prevent a "thundering herd" problem, where many clients, all retrying with the same exponential backoff, might all hit the recovering server at the exact same moment, causing it to crash again. Together, they create a more graceful and less resource-intensive retry strategy, improving system resilience.
5. Can a connection timeout be caused by an application deadlock, and how would I diagnose that?
Yes, absolutely. If an application encounters a deadlock (e.g., two threads waiting for each other to release resources, or two database transactions holding locks that prevent each other from progressing), the affected requests can hang indefinitely. From the client's perspective, this will manifest as a connection timeout because the application simply stops responding within the expected timeframe. To diagnose this, you would look at: 1. Application Logs: Search for messages indicating deadlocks (e.g., "Deadlock detected" in database logs, or thread dump analysis showing blocking calls). 2. Application Monitoring: High thread pool utilization with no active processing, or a sudden drop in application throughput without corresponding resource spikes. 3. Database Monitoring: Check for active locks, blocked sessions, and long-running transactions within your database management system. Profiling tools can also provide deep insights into thread states and resource contention within the application's runtime.
🚀You can securely and efficiently call the OpenAI API on APIPark in just two steps:
Step 1: Deploy the APIPark AI gateway in 5 minutes.
APIPark is developed based on Golang, offering strong product performance and low development and maintenance costs. You can deploy APIPark with a single command line.
curl -sSO https://download.apipark.com/install/quick-start.sh; bash quick-start.sh

In my experience, you can see the successful deployment interface within 5 to 10 minutes. Then, you can log in to APIPark using your account.

Step 2: Call the OpenAI API.