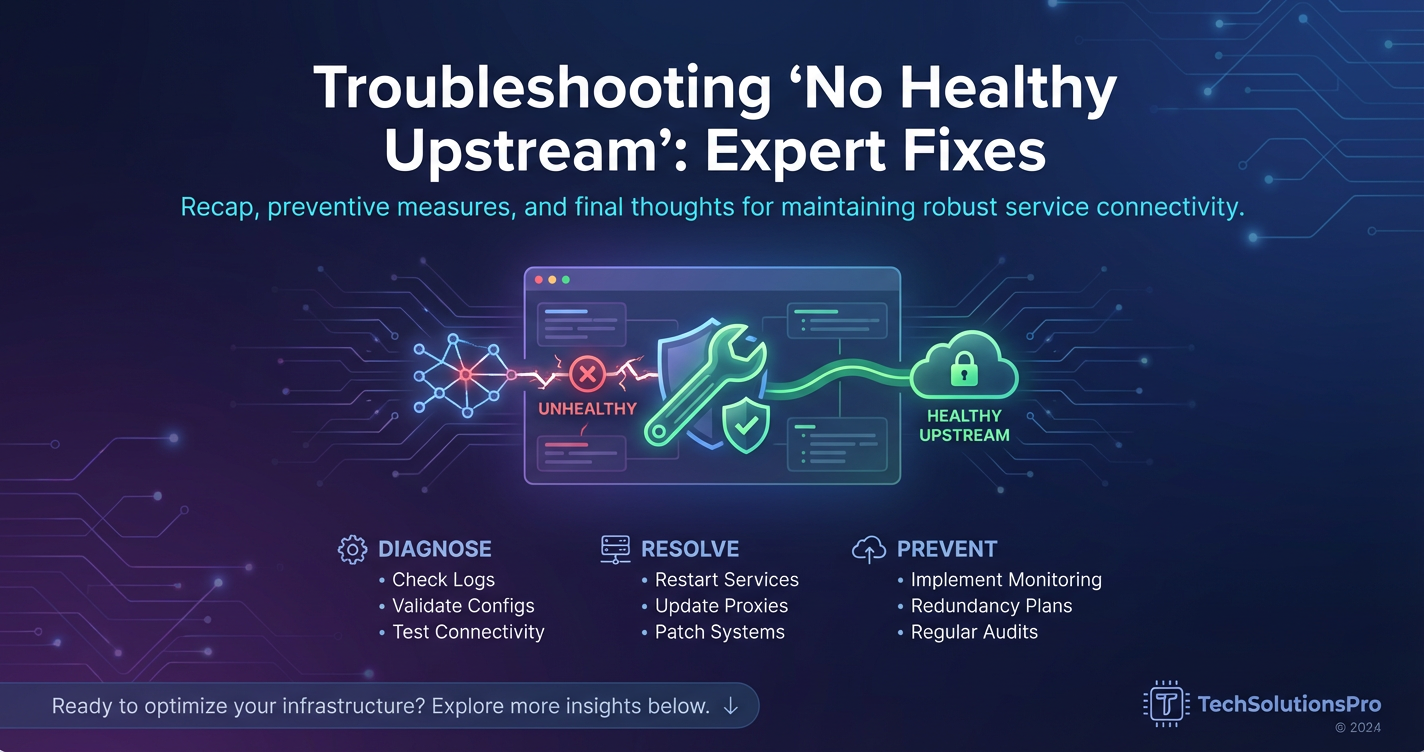
Troubleshooting 'No Healthy Upstream': Expert Fixes


In the complex tapestry of modern microservices architectures and distributed systems, the phrase "No Healthy Upstream" is a chilling declaration. It signifies a critical break in the chain of communication, often leaving users staring at error messages and developers scrambling for solutions. This elusive error, typically encountered when an API gateway or reverse proxy cannot establish or maintain a healthy connection with its designated backend services, represents a fundamental failure in service availability. It’s more than just a momentary glitch; it points to deeper issues within network configuration, service health, or the very heartbeat of your application infrastructure. Understanding, diagnosing, and ultimately resolving "No Healthy Upstream" is paramount for anyone managing an API gateway, for it directly impacts the reliability, performance, and user experience of any API-driven platform.
This comprehensive guide delves into the intricate layers of troubleshooting this pervasive issue. We will embark on a methodical journey, dissecting the error from its foundational principles to advanced diagnostics. Our aim is to equip you with an expert toolkit, enabling you to systematically identify root causes, implement effective fixes, and fortify your systems against future occurrences. From initial connectivity checks and configuration audits to deep dives into health checks, network infrastructure, and specific gateway implementations, we will cover every conceivable angle. By the end of this exploration, the "No Healthy Upstream" error, once a source of dread, will transform into a diagnostic challenge you are well-prepared to conquer, ensuring your APIs remain robust, responsive, and relentlessly available.
Understanding the 'No Healthy Upstream' Error
At its core, "No Healthy Upstream" means that the API gateway or proxy responsible for routing client requests to backend services has failed to identify any of those backend services as operational and ready to receive traffic. An "upstream" in this context refers to a server, a group of servers, or a service that the gateway is configured to forward requests to. When a gateway reports "No Healthy Upstream," it's essentially saying, "I have nowhere to send this request because all my designated recipients are either unresponsive, unreachable, or have explicitly signaled that they are not fit to handle traffic."
This error is not a single, isolated problem but rather a symptom of various underlying issues. It can manifest in different forms depending on the specific API gateway or reverse proxy software being used. For instance, in Nginx, you might see "no live upstreams," while in Envoy Proxy, it could be related to cluster health. Cloud-based API gateways like AWS API Gateway might report similar issues through integration errors, indicating the backend Lambda function or EC2 instance is not responding as expected. Regardless of the specific wording, the implication is the same: the connection between the gateway and its backend APIs has been severed or was never properly established.
The critical nature of this error cannot be overstated. When an API gateway is unable to reach its upstream services, all incoming requests for those services will fail. This translates directly to service outages, frustrated users, potential data loss, and significant business impact. In a microservices architecture, where many services communicate through APIs managed by gateways, a single "No Healthy Upstream" error can cascade, crippling an entire ecosystem. Therefore, a deep understanding of its causes and a systematic approach to troubleshooting are indispensable for maintaining the integrity and availability of modern applications.
The Architecture of API Gateways and Upstreams
To effectively troubleshoot "No Healthy Upstream," one must first grasp the architectural context in which it occurs. An API gateway serves as the single entry point for all clients consuming your APIs. It acts as a facade, abstracting the complexity of your backend services and providing a centralized point for concerns such as authentication, authorization, rate limiting, logging, and routing. Behind this facade lies a collection of "upstream" services, which are the actual backend applications or microservices that implement the business logic and data operations.
How API Gateways Work:
When a client sends a request, it first hits the API gateway. The gateway then examines the request (e.g., URL path, headers) to determine which backend service should handle it. Based on its routing rules, the gateway forwards the request to one of its configured upstream servers. This forwarding typically involves:
- Service Discovery: Identifying the network location (IP address and port) of the backend service.
- Load Balancing: Distributing requests across multiple instances of a healthy backend service to ensure optimal resource utilization and high availability.
- Connection Management: Establishing and maintaining connections with the upstream services.
The Role of Health Checks:
Central to the concept of a "healthy upstream" are health checks. An API gateway doesn't just blindly send requests to an upstream server; it constantly monitors the health of these servers. Health checks are periodic probes sent by the gateway (or an associated load balancer) to each upstream instance to determine if it is alive, responsive, and capable of processing requests.
These checks can be simple (e.g., a TCP connection check to a specific port) or more sophisticated (e.g., an HTTP GET request to a /health endpoint that performs internal checks on database connections or other dependencies). Based on the responses to these probes, the gateway marks an upstream instance as "healthy" or "unhealthy." Only healthy instances are included in the load balancing pool; if all instances become unhealthy, the dreaded "No Healthy Upstream" error is triggered.
Load Balancing Strategies and Upstream Health:
Load balancing is inextricably linked to upstream health. The effectiveness of load balancing algorithms (e.g., round-robin, least connections, IP hash) relies entirely on an accurate and up-to-date understanding of which upstream instances are available. If a service instance becomes unhealthy, the load balancer must promptly remove it from the rotation to prevent requests from being sent to a failing service. Conversely, when an unhealthy instance recovers, it must be quickly reintroduced into the pool.
A well-configured API gateway or load balancer, therefore, continuously maintains a dynamic list of healthy upstream servers. When this list becomes empty, it indicates a critical failure in the entire backend service layer, or a misconfiguration that prevents the gateway from accurately assessing their health. Understanding this interplay between the gateway, its health checks, and the load balancing mechanism is the first crucial step in diagnosing the "No Healthy Upstream" error. Without healthy upstreams, the API gateway effectively becomes a dead end for client requests.
Phase 1: Initial Diagnosis and Verification (The Basics)
When confronted with a "No Healthy Upstream" error, the most effective approach is to start with the basics. Many complex problems have simple origins, and systematically checking fundamental components can often save hours of deeper, more intricate troubleshooting. This phase focuses on verifying connectivity, the operational status of upstream services, and the accuracy of API gateway configurations.
1. Connectivity Checks
The most immediate cause of an upstream being deemed unhealthy is a complete lack of network connectivity. The API gateway simply cannot reach the upstream service.
- Ping/Traceroute from the API Gateway Server to the Upstream:
- Purpose: To verify basic IP-level reachability.
pingsends ICMP echo requests and measures response times, indicating if the upstream host is alive on the network.traceroute(ortracerton Windows) maps the network path between the gateway and the upstream, helping identify where connectivity breaks down (e.g., a specific router or firewall). - How to Perform:
- Obtain the IP address or hostname of the upstream server from your API gateway configuration.
- From the API gateway server's command line:
bash ping <upstream_ip_or_hostname> traceroute <upstream_ip_or_hostname>
- Interpretation: If
pingfails (100% packet loss) ortracerouteshows a break before reaching the upstream, you have a network connectivity issue. Ifpingworks but is slow, it indicates latency that might impact health check timeouts.
- Purpose: To verify basic IP-level reachability.
- Telnet/Netcat to the Upstream Server's Port:
- Purpose:
pingonly verifies IP-level reachability.telnetornc(Netcat) checks if a specific port on the upstream server is open and listening. This is crucial because an upstream server might be reachable via IP, but its application port could be closed or blocked. - How to Perform:
- From the API gateway server's command line:
bash telnet <upstream_ip_or_hostname> <upstream_port> # Or using netcat nc -vz <upstream_ip_or_hostname> <upstream_port>
- From the API gateway server's command line:
- Interpretation: A successful
telnetconnection (orncshowing "Connection to ... succeeded!") indicates the port is open and listening. If it hangs or returns "Connection refused/timed out," it suggests the application isn't listening on that port, or a firewall is blocking it.
- Purpose:
- Firewall Rules (Inbound/Outbound):
- Purpose: Firewalls, both on the operating system level (e.g.,
iptables,firewalldon Linux, Windows Firewall) and at the network perimeter (hardware firewalls, cloud security groups), are common culprits. They might block the API gateway from initiating connections to the upstream, or prevent the upstream from responding to the gateway's health checks. - How to Check:
- On the API Gateway Server: Verify outbound rules allow connections to the upstream's IP and port.
- On the Upstream Server: Verify inbound rules allow connections from the API gateway's IP and port (and any health check IPs).
- Network Firewalls/Security Groups: Consult your network team or cloud provider's console (e.g., AWS Security Groups, Azure Network Security Groups, GCP Firewall Rules) to ensure rules permit traffic between the gateway and upstream.
- Example: A common mistake is allowing port 80/443 traffic from anywhere, but forgetting to allow health check traffic from the API gateway's specific internal IP.
- Purpose: Firewalls, both on the operating system level (e.g.,
2. Upstream Server Status
Even if network paths are clear, the upstream application itself might not be running correctly or at all.
- Is the Upstream Application Running?
- Purpose: Confirm that the backend service intended to serve the API is actively operational.
- How to Check:
- For system services:
systemctl status <service_name>(Linux) or check Windows Services. - For Docker containers:
docker psto see running containers. - For Kubernetes pods:
kubectl get pods -n <namespace>andkubectl describe pod <pod_name>to check status and events. - Check application-specific logs for startup failures, crashes, or unhandled exceptions.
- For system services:
- Interpretation: If the service is stopped, crashed, or repeatedly restarting, this is a clear cause. Start or restart the service and monitor its logs.
- Is the Upstream Server Itself Online?
- Purpose: Beyond the application, is the underlying server/VM/container host healthy?
- How to Check: Use cloud provider dashboards, hypervisor consoles, or simple
sshaccess. - Interpretation: A completely down server will, of course, lead to "No Healthy Upstream."
- Check Application Logs on the Upstream Server:
- Purpose: Application logs often provide the most direct clues about why a service isn't healthy. Look for:
- Port binding conflicts (e.g., another process already using the required port).
- Database connection failures.
- Configuration errors during startup.
- Out-of-memory errors or other resource exhaustion.
- Uncaught exceptions causing the application to crash or become unresponsive.
- How to Check: Locate the application's log files (e.g.,
/var/log/<app>,stdout/stderrfor containers, application-specific log directories).
- Purpose: Application logs often provide the most direct clues about why a service isn't healthy. Look for:
3. Configuration Review (Gateway Side)
A simple typo or misconfiguration in the API gateway itself is a surprisingly common reason for "No Healthy Upstream."
- Check API Gateway Configuration Files:
- Purpose: Verify that the API gateway is correctly instructed on where to find its upstream services.
- How to Check:
- Nginx: Examine
nginx.confand any included configuration files (e.g.,/etc/nginx/conf.d/*.conf). Focus onupstreamblocks andproxy_passdirectives. - Envoy Proxy: Inspect
envoy.yamlforclustersdefinitions, ensuring correct addresses and ports. - HAProxy: Review
haproxy.cfg, paying attention tobackendsections andserverdirectives. - Cloud Gateways (AWS API Gateway, Azure API Management): Check the service integration settings in the respective cloud console.
- Open-source solutions like APIPark: Verify the configuration within its management interface or underlying configuration files for correct service endpoint registration and routing rules. APIPark as an AI Gateway and API Management Platform provides a unified system for managing API integrations, and misconfigurations here can certainly lead to unreachable backends. Its detailed logging can be particularly useful in quickly identifying such issues.
- Nginx: Examine
- Specifics to Look For:
- Upstream Server Addresses (IP/Port, Hostname): Are they absolutely correct? A single digit or letter off can break everything.
- Protocols: Is the gateway attempting to connect via HTTP when the upstream expects HTTPS, or vice-versa?
- Port Mappings: Is the upstream service listening on port X, but the gateway configured to connect to port Y?
- Load Balancer Configuration: If using a separate load balancer between the gateway and upstream, verify its configuration as well.
- Restart the API Gateway:
- Purpose: After any configuration changes, or just as a diagnostic step, restarting the API gateway ensures it reloads its configuration and re-establishes connections.
- How to Perform:
systemctl restart <gateway_service>(Linux),docker restart <container_id>, or specific commands for cloud services. - Interpretation: If the error clears after a restart with no configuration changes, it might indicate a transient issue, a caching problem, or a bug in the gateway software that a restart resolved.
4. DNS Resolution
If your API gateway is configured to use hostnames for upstream services, DNS resolution becomes a critical dependency.
- Verify DNS Resolution from the API Gateway Server:
- Purpose: Ensure the API gateway can correctly translate the upstream hostname into an IP address.
- How to Check:
- From the API gateway server:
dig <upstream_hostname>ornslookup <upstream_hostname>.
- From the API gateway server:
- Interpretation: If DNS resolution fails, or resolves to an incorrect IP address, the gateway will be unable to find its upstream. Check your
/etc/resolv.conf(Linux) or network adapter settings for correct DNS server configurations. - Potential DNS Cache Issues: If DNS records were recently changed, the API gateway or the underlying operating system might be caching old, incorrect DNS entries. A restart of the gateway or clearing OS DNS caches might be necessary. Some gateways (like Nginx) only resolve DNS names once at startup, requiring a reload to pick up changes.
By meticulously working through these initial checks, you can often identify and resolve the majority of "No Healthy Upstream" issues before needing to delve into more complex layers. This systematic approach ensures no simple misconfiguration or connectivity breakdown is overlooked.
Phase 2: Deep Dive into Health Checks and Load Balancing
Once basic connectivity and configuration are verified, the focus shifts to the sophisticated interplay of health checks and load balancing. These mechanisms are the very heart of how an API gateway determines the "health" of its upstreams, and subtle misconfigurations here can be notoriously difficult to diagnose.
1. Understanding Health Checks
Health checks are the API gateway's way of taking the pulse of its backend services. They are critical for ensuring that requests are only routed to services that are truly ready and capable of processing them.
- Passive vs. Active Health Checks:
- Active Health Checks: These are explicit, periodic probes initiated by the gateway itself. The gateway actively sends requests (e.g., TCP handshakes, HTTP GETs) to a predefined endpoint on each upstream instance at a set interval. If an instance fails a certain number of these checks, it's marked unhealthy.
- Passive Health Checks (Outlier Detection): These checks observe the behavior of requests passed through the gateway. If an upstream consistently returns errors (e.g., 5xx status codes), or if connections time out frequently, the gateway might temporarily mark it unhealthy and remove it from the load balancing pool without an explicit health check probe. This is common in more advanced gateways like Envoy Proxy.
- Importance: Both types are crucial. Active checks confirm basic reachability, while passive checks react to real-world performance issues.
- Types of Health Checks:
- TCP Health Check: The simplest form. The gateway attempts to establish a TCP connection to a specific port on the upstream. If the connection succeeds, the instance is considered healthy. This only verifies that the network stack is listening, not necessarily that the application is fully functional.
- HTTP/S Health Check: More robust. The gateway sends an HTTP GET request to a specific path (e.g.,
/health,/status) on the upstream. The upstream application is expected to respond with a success status code (typically 200 OK) and potentially a specific body content. This verifies network, application server, and even internal application dependencies if the/healthendpoint is well-designed. - Custom Scripts/External Checks: Some gateways allow for external scripts or programs to be executed, providing highly flexible health checks that can involve complex logic, multiple dependency checks, or integration with external monitoring systems.
- Configuration Parameters: Interval, Timeout, Thresholds:
- Interval: How frequently the gateway performs health checks (e.g., every 5 seconds). A too-long interval can delay detecting unhealthy services, while a too-short interval can add unnecessary load.
- Timeout: How long the gateway waits for a response from the upstream during a health check. If the upstream doesn't respond within this period, the check fails. This is a critical parameter often misconfigured.
- Unhealthy/Healthy Thresholds:
- Unhealthy Threshold: The number of consecutive failed health checks required to mark an upstream instance as unhealthy. This prevents transient network glitches from immediately removing a service.
- Healthy Threshold: The number of consecutive successful health checks required to mark a previously unhealthy instance as healthy again. This prevents flapping and ensures the service is truly recovered before reintroducing it.
- How a Gateway Determines an Upstream is "Healthy" or "Unhealthy": Based on the configured types, intervals, timeouts, and thresholds, the API gateway maintains an internal state for each upstream instance.
- A new instance starts as "unknown" or "initializing."
- It undergoes initial health checks.
- If it passes enough checks, it becomes "healthy" and enters the load balancing pool.
- If it fails checks, it's marked "unhealthy" and removed from the pool.
- While "unhealthy," the gateway continues to probe it.
- If it passes enough checks while unhealthy, it transitions back to "healthy." The "No Healthy Upstream" error occurs when all instances configured for a particular API route are in the "unhealthy" state.
2. Common Health Check Pitfalls
Misconfigurations or misunderstandings of health checks are frequent causes of "No Healthy Upstream."
- Health Check Endpoint Not Correctly Implemented on the Upstream:
- Problem: The backend service might not have a
/healthendpoint, or it might return an incorrect status code (e.g., 404 Not Found, 500 Internal Server Error) instead of 200 OK, even when the application is technically running. - Fix: Ensure the backend API implements a dedicated health check endpoint that genuinely reflects its operational status and returns 200 OK only when it's ready for traffic.
- Problem: The backend service might not have a
- Health Check Endpoint Returning Non-2xx Status Codes for Valid Reasons:
- Problem: An application might intentionally return a non-2xx status (e.g., 503 Service Unavailable) during maintenance or graceful shutdown. If the gateway is configured to only accept 200 OK, it will mark the service unhealthy, even if the intent was to signal a temporary state.
- Fix: Configure the API gateway to accept a range of success codes (e.g., 200-399) or specific non-2xx codes that denote a "soft" healthy state if your application uses them.
- Insufficient Health Check Timeout Causing False Negatives:
- Problem: If the health check timeout is too short, and the upstream service experiences even slight latency spikes, the check might time out prematurely, leading the gateway to incorrectly deem it unhealthy.
- Fix: Increase the health check timeout slightly, ensuring it's longer than typical worst-case response times for the
/healthendpoint. Balance this with the need for quick detection of truly unresponsive services.
- Firewalls Blocking Health Check Probes:
- Problem: Similar to general connectivity issues, firewalls can specifically block the health check requests while allowing regular API traffic. This is particularly insidious because client requests might sometimes succeed (if the service was marked healthy before the firewall rule change), but the health checks will continuously fail.
- Fix: Explicitly verify that firewall rules (OS, network, security groups) permit traffic from the API gateway's IP to the upstream's health check port and path.
- Network Latency Impacting Health Checks:
- Problem: High network latency between the API gateway and the upstream can cause health checks to frequently time out or be delayed, even if the upstream service itself is performant.
- Fix: Investigate network infrastructure for bottlenecks. Adjust health check timeouts and intervals to accommodate reasonable latency. Consider co-locating gateway and upstream services where possible to minimize network hops.
3. Load Balancer Configuration
If a separate load balancer sits between your API gateway and upstream services (or if the API gateway itself performs load balancing), its configuration is crucial.
- Is the Load Balancer Correctly Configured to Use the Health Checks?
- Problem: A load balancer might be configured but not actively using its health check mechanisms, or it might be configured with different, less aggressive, or incorrect health check parameters than the API gateway.
- Fix: Review the load balancer's configuration (e.g., AWS Elastic Load Balancer, Azure Load Balancer, HAProxy, Nginx
upstreammodule settings). Ensure health checks are enabled, correctly pointing to the upstream's health endpoint, and have appropriate timeouts/thresholds.
- Sticky Sessions/Session Affinity Issues (Less Common but Related):
- Problem: While not a direct cause of "No Healthy Upstream," if sticky sessions are enabled and a particular upstream instance becomes unhealthy, clients tied to that instance will continuously receive errors until the session expires or the instance recovers, potentially masking the overall health of the service.
- Fix: Understand the implications of sticky sessions. For true high availability and resilience against upstream failures, it's often better to design stateless services where any instance can handle any request.
- Load Balancing Algorithms and Their Interaction with Upstream State:
- Problem: While algorithms like round-robin or least connections are generally robust, if the gateway's view of upstream health is flawed, even the best algorithm will route requests incorrectly.
- Fix: Ensure the health check mechanism provides an accurate, real-time reflection of upstream health. Monitor the load balancer's statistics to confirm it's correctly identifying and bypassing unhealthy instances.
By meticulously examining these health check and load balancing aspects, you can uncover subtle but critical issues that prevent your API gateway from accurately assessing and utilizing its upstream services, leading directly to the "No Healthy Upstream" conundrum.
APIPark is a high-performance AI gateway that allows you to securely access the most comprehensive LLM APIs globally on the APIPark platform, including OpenAI, Anthropic, Mistral, Llama2, Google Gemini, and more.Try APIPark now! 👇👇👇
Phase 3: Network and Infrastructure-Level Troubleshooting
After exhausting initial checks and deep-diving into health checks, if the "No Healthy Upstream" error persists, the problem likely lies deeper within the network infrastructure or resource constraints of the underlying servers. These issues require a more granular examination of how data flows and how resources are consumed.
1. Network Latency and Jitter
Even with perfect connectivity, slow or inconsistent network performance can mimic a downed service, causing health checks to time out and legitimate requests to fail.
- Impact on Health Checks and Connection Timeouts:
- Problem: If the round-trip time between the API gateway and the upstream consistently exceeds the health check timeout or the general connection timeout configured in the gateway, the upstream will be marked unhealthy or requests will fail, even if the service itself is responsive. Jitter (variation in latency) can make this problem intermittent and harder to diagnose.
- Diagnosis with Tools:
ping -c <count> <upstream_ip>: Use a higher count to get a more accurate average and standard deviation of latency. Look for high average RTT and significant variations.mtr <upstream_ip>(My Traceroute): This tool combinespingandtraceroute, continuously sending packets and reporting latency and packet loss at each hop. It's invaluable for identifying specific network devices (routers, switches) that are introducing latency or experiencing issues.iperf: Used to measure network bandwidth and throughput. While not directly for latency, poor bandwidth can lead to longer response times for larger payloads, potentially hitting timeouts. Runiperfbetween the API gateway server and the upstream server to assess link quality.
- Potential Causes: Network congestion, overloaded routers/switches, misconfigured QoS (Quality of Service) policies, geographical distance between the gateway and upstream, or issues with the underlying cloud network fabric.
- Fixes: Optimize network paths, review QoS settings, scale network devices, consider closer co-location of services, or adjust gateway timeouts to be more forgiving of inherent network latency (with caution).
2. Packet Loss
Packet loss is a critical network issue where data packets sent over the network fail to reach their destination. This directly impacts communication and can make healthy services appear unhealthy.
- Diagnosis with
pingandmtr:- Problem: If
pingshows significant packet loss (e.g., 20% or more), ormtrindicates packet loss at specific hops, it means network reliability is compromised. - Fix:
- Check
ping -c <count> <upstream_ip>: A high percentage of lost packets is a clear indicator. - Check
mtr <upstream_ip>: It will highlight which network hop is dropping packets, pointing to a specific device or segment.
- Check
- Potential Causes: Faulty network cables, congested switches/routers, misconfigured network devices, duplex mismatches, overloaded network interfaces, wireless interference, or security devices aggressively dropping packets.
- Fixes: Replace faulty hardware, reconfigure network devices, investigate network congestion points, review firewall/IDS/IPS logs for dropped packets.
- Problem: If
3. Resource Exhaustion on Upstream
An upstream service might be running and reachable, but if it's starved of resources, it can become unresponsive or extremely slow, leading the API gateway to mark it unhealthy.
- CPU, Memory, Disk I/O on the Backend Server:
- Problem:
- High CPU usage: The application is too busy to process requests or even respond to health checks.
- Memory exhaustion: The application crashes, becomes unstable, or spends excessive time swapping to disk.
- High Disk I/O: Can indicate problems with logging, database operations, or disk contention, leading to slow application responses.
- Tools for Diagnosis:
toporhtop: Real-time view of CPU, memory, and process usage.free -h: Check available memory.iostat -xz 1: Monitor disk I/O usage (read/write speeds, utilization, wait times).dstat -cdlnp: Provides a comprehensive overview of CPU, disk, network, and process metrics.
- Fixes: Optimize application code, increase server resources (vertical scaling), scale out the service (horizontal scaling), optimize database queries, address logging verbosity, or fix memory leaks.
- Problem:
- Open File Descriptor Limits:
- Problem: Every network connection, open file, or socket consumes a file descriptor. If the upstream server reaches its operating system limit for open file descriptors (
ulimit -n), it cannot establish new connections or open files, causing it to effectively freeze or reject new requests. - Diagnosis:
ulimit -n(to see the current limit) andlsof | wc -l(to count currently open file descriptors). Check application logs for "Too many open files" errors. - Fix: Increase the
ulimit -nfor the user running the application (temporarily) and permanently in/etc/security/limits.confor equivalent. Optimize the application to close unused file descriptors.
- Problem: Every network connection, open file, or socket consumes a file descriptor. If the upstream server reaches its operating system limit for open file descriptors (
- Database Connection Limits:
- Problem: Many applications rely on a database. If the upstream service exhausts its pool of database connections, it cannot process requests that require database interaction, becoming unresponsive.
- Diagnosis: Check database logs for "max connections reached" errors. Monitor the application's connection pool metrics.
- Fixes: Increase database connection limits, optimize database queries, implement connection pooling correctly in the application, or scale the database.
4. Resource Exhaustion on Gateway
It's not always the upstream; sometimes the API gateway itself is struggling under load.
- Can the API Gateway Itself Handle the Load?
- Problem: An overloaded API gateway might be unable to initiate new connections to upstream services, process health checks, or manage existing connections, leading to "No Healthy Upstream" errors from its perspective.
- Diagnosis: Monitor CPU, memory, and network I/O on the gateway server using
top,htop,dstat. - Fixes: Scale the API gateway horizontally (add more instances), optimize its configuration (e.g.,
worker_processes,worker_connectionsin Nginx), or offload some responsibilities (e.g., move TLS termination to a dedicated load balancer).
- Too Many Open Connections, Ephemeral Port Exhaustion:
- Problem: The API gateway makes outbound connections to upstreams. If it rapidly opens and closes many connections, it can exhaust its pool of ephemeral ports, preventing it from making new outbound connections until ports are recycled.
- Diagnosis:
netstat -nat | grep TIME_WAIT | wc -l(check for a high number of TIME_WAIT connections). Check gateway logs for "Cannot assign requested address" or similar socket errors. - Fixes: Adjust kernel parameters (e.g.,
net.ipv4.tcp_tw_reuse,net.ipv4.ip_local_port_rangeinsysctl.conf), enable TCP keepalives, or optimize the gateway to reuse connections (e.g., Nginxproxy_http_version 1.1; proxy_set_header Connection "";for HTTP/1.1 keepalives).
- Gateway Logs Revealing Connection Errors, Resource Warnings:
- Purpose: The API gateway's own logs are a treasure trove of information. They often explicitly state why an upstream connection failed or why an instance was marked unhealthy.
- How to Check: Examine gateway access logs and error logs. Look for specific error codes (e.g., 502 Bad Gateway), connection refused messages, timeout messages, or warnings about resource limits.
5. Operating System Limits
The underlying operating system settings can impose limits that affect network operations and resource availability.
sysctlParameters:- Purpose: Kernel parameters control various aspects of networking and process management. Misconfigured or default low limits can cause issues under load.
- Key Parameters to Check (Linux, via
sysctl -a):net.core.somaxconn: Maximum length of the queue of pending connections. If too low, connection attempts might be dropped.net.ipv4.tcp_tw_reuse,net.ipv4.tcp_tw_recycle: Related to TIME_WAIT state and ephemeral port reuse (as mentioned above).tcp_tw_recycleis often problematic and usually recommended to be disabled.net.ipv4.ip_local_port_range: The range of ephemeral ports available for outbound connections. If this range is too small, exhaustion is more likely.- TCP buffer sizes (
net.ipv4.tcp_rmem,net.ipv4.tcp_wmem): Can affect network throughput and performance.
- Fix: Adjust these parameters based on workload and server role. Apply changes permanently in
/etc/sysctl.conf.
ulimit -nfor Open File Descriptors:- Purpose: As mentioned for upstream servers, the API gateway itself also has an
ulimitfor file descriptors. If it opens many connections, it can hit this limit. - Diagnosis & Fix: Similar to upstream servers, check and increase the limit for the gateway process.
- Purpose: As mentioned for upstream servers, the API gateway itself also has an
By diligently investigating these network and infrastructure layers, you move beyond the immediate symptoms to uncover the deeper, often systemic causes of "No Healthy Upstream." These issues require a holistic view of your entire service ecosystem.
Phase 4: Advanced Scenarios and Specific Gateway Implementations
The "No Healthy Upstream" error, while universal in its meaning, can manifest and be troubleshot differently depending on the specific environment and API gateway technology in use. This phase explores advanced scenarios, particularly in containerized and cloud environments, and provides targeted advice for common gateway implementations.
1. Containerized Environments (Docker, Kubernetes)
Containerization introduces an additional layer of abstraction and networking complexity.
- Service Discovery Issues (kube-DNS, Internal DNS):
- Problem: In Kubernetes, services are typically accessed by their service names, which are resolved by
kube-dnsor CoreDNS. If DNS resolution fails within the pod running the API gateway or the upstream service, communication breaks. - Diagnosis:
kubectl exec -it <gateway_pod> -- nslookup <upstream_service_name>: Test DNS resolution directly from the gateway pod.- Check
kube-dnsor CoreDNS pod health and logs. - Verify
ServiceandEndpointobjects in Kubernetes (kubectl get svc,kubectl get ep).
- Fix: Ensure DNS services are healthy, service names are correct, and pods have appropriate
dnsPolicysettings.
- Problem: In Kubernetes, services are typically accessed by their service names, which are resolved by
readiness probesandliveness probesin Kubernetes:- Problem: These probes are Kubernetes' built-in health checks.
- Liveness Probe: Determines if a container is running. If it fails, Kubernetes restarts the container.
- Readiness Probe: Determines if a container is ready to serve traffic. If it fails, Kubernetes removes the pod from service endpoints until it becomes ready again.
- Impact on 'No Healthy Upstream': A failing readiness probe for an upstream service will result in Kubernetes not sending traffic to that pod, which is equivalent to the API gateway finding "No Healthy Upstream." A failing liveness probe might lead to a crash-looping pod, which will also never be ready.
- Diagnosis:
kubectl describe pod <upstream_pod_name>: Look forLiveness probe failedorReadiness probe failedevents. Check the/healthendpoint directly from inside the cluster if possible. - Fix: Correct the issues causing probe failures within the application (e.g., resource starvation, deadlocks, incorrect health endpoint logic). Ensure probes are configured with appropriate
initialDelaySeconds,periodSeconds, andtimeoutSeconds.
- Problem: These probes are Kubernetes' built-in health checks.
- Network Policies:
- Problem: Kubernetes Network Policies restrict traffic between pods. A policy might inadvertently block communication from the API gateway pod to the upstream service pod, or prevent health checks.
- Diagnosis:
kubectl get networkpolicy -n <namespace>: Review existing policies and ensure they allow necessary traffic. - Fix: Adjust network policies to permit inbound traffic to the upstream service from the API gateway's namespace/labels.
- Ingress Controllers as Specialized API Gateways:
- Problem: Many Kubernetes deployments use Ingress Controllers (like Nginx Ingress Controller, Traefik, Istio Ingress Gateway) which act as an API gateway for traffic entering the cluster. They also manage upstream health.
- Diagnosis: Check Ingress Controller pod logs,
Ingressresource status (kubectl get ing), and associatedServiceandEndpointobjects. The same health check principles apply to how Ingress Controllers determine backend service health. - Fix: Ensure Ingress resources are correctly configured, service endpoints are updated, and underlying service pods are healthy.
2. Cloud-Specific Gateways (AWS API Gateway, Azure API Management, GCP API Gateway)
These managed API gateway services abstract much of the infrastructure, but they have their own integration nuances.
- Integration with Backend Services (Lambda, EC2, Azure Functions, Cloud Run):
- Problem: The API gateway in the cloud must be correctly integrated with the specific backend compute service. Misconfigurations in the integration request/response, method settings, or target resource paths can lead to "No Healthy Upstream" (or equivalent integration errors).
- Diagnosis: Review the API gateway's integration settings in the cloud console. Check backend service logs (Lambda logs, EC2 instance logs, Function App logs) for invocation errors or startup issues.
- Fix: Verify the backend target (e.g., Lambda ARN, HTTP endpoint URL) is correct. Ensure integration types (proxy, custom) and request/response mappings are correctly defined.
- VPC Links, Private Endpoints, Network Configuration:
- Problem: If backend services are in a private network (VPC), the cloud API gateway needs a secure, private connection (e.g., AWS VPC Link, Azure Private Link). Misconfigurations here will prevent the gateway from reaching the backend.
- Diagnosis: Check the status and configuration of VPC Links or Private Endpoints in your cloud console. Verify associated security groups and network ACLs allow traffic.
- Fix: Ensure VPC Links are active, correctly associated with the API gateway and target Network Load Balancer (NLB) or internal IP addresses.
- IAM Roles and Permissions (AWS, Azure):
- Problem: The API gateway itself might lack the necessary IAM role permissions to invoke a Lambda function or access a private resource. This isn't strictly "No Healthy Upstream" but effectively prevents integration.
- Diagnosis: Check CloudWatch logs (for AWS API Gateway), Azure Monitor logs, or GCP Cloud Logging for permission-denied errors. Review the IAM role attached to the API gateway or the integration.
- Fix: Grant the API gateway the appropriate permissions (e.g.,
lambda:InvokeFunction).
- Service Integrations and Mapping Templates:
- Problem: Incorrect request or response mapping templates can cause the backend to receive malformed requests or the gateway to fail when interpreting the backend's response, leading to perceived unhealthiness.
- Diagnosis: Use the
Testfeature in the cloud API gateway console. Inspect the logs for detailed integration request/response errors. - Fix: Correct the mapping templates to accurately transform client requests into backend-expected formats and backend responses into client-expected formats.
3. Reverse Proxies (Nginx, Apache HTTPD)
These are common workhorses for API gateway functionality, but require careful configuration.
proxy_passDirectives:- Problem: The fundamental directive that tells Nginx where to forward requests. Typos or incorrect values here are a primary cause.
- Diagnosis: Review
nginx.confand included files for theproxy_passdirective withinlocationblocks. - Fix: Ensure
proxy_passpoints to the correctupstreamblock name or direct IP:port.
upstreamBlocks:- Problem: Nginx
upstreamblocks define groups of backend servers. Incorrect server addresses, ports, or missing health check parameters here will break things. - Diagnosis: Carefully check each
serverdirective within theupstreamblock for correctIP:portand any specific parameters likeweight,max_fails,fail_timeout. - Fix: Correct server definitions. Adjust
max_fails(number of failed attempts before marking unhealthy) andfail_timeout(how long the server is considered unhealthy) to reasonable values.
- Problem: Nginx
proxy_connect_timeout,proxy_read_timeout:- Problem: These Nginx directives control how long Nginx waits to establish a connection to an upstream and how long it waits for a response after the connection is established. If too short, network latency or slow backend processing can trigger timeouts.
- Diagnosis: Check Nginx error logs for "upstream timed out (110: Connection timed out)" or similar messages.
- Fix: Increase these timeouts (e.g.,
proxy_connect_timeout 5s; proxy_read_timeout 60s;).
keepaliveSettings:- Problem: If Nginx doesn't reuse connections to upstream servers (e.g.,
proxy_http_version 1.1; proxy_set_header Connection "";is missing), it has to establish a new TCP connection for every request, which is inefficient and can lead to ephemeral port exhaustion or slow performance under high load, potentially causing perceived unhealthiness. - Fix: Ensure Nginx is configured to use HTTP/1.1 and send an empty
Connectionheader to enable keepalives with upstreams.
- Problem: If Nginx doesn't reuse connections to upstream servers (e.g.,
4. Envoy Proxy
Envoy is a popular, high-performance proxy for service mesh and API gateway deployments, with sophisticated health checking and outlier detection.
- Cluster Configurations:
- Problem: Envoy defines groups of logical upstreams as "clusters." Incorrectly defined
hostswithin a cluster, wrongconnect_timeout, or missingtype(e.g.,STRICT_DNS,LOGICAL_DNS,EDS) can lead to problems. - Diagnosis: Review the Envoy configuration file (
envoy.yaml) forstatic_resources.clusters. - Fix: Ensure cluster names,
connect_timeout, andlb_policy(load balancing policy) are correct.
- Problem: Envoy defines groups of logical upstreams as "clusters." Incorrectly defined
- Health Check Policies:
- Problem: Envoy's health check configuration is very granular. Misconfigured
timeout,interval,unhealthy_threshold,healthy_threshold, or thepathfor HTTP health checks can cause issues. - Diagnosis: Check the
health_checkssection within your cluster configuration. - Fix: Fine-tune these parameters. Ensure the
pathcorrectly points to your backend's health endpoint.
- Problem: Envoy's health check configuration is very granular. Misconfigured
- Service Discovery (Static, EDS, DNS):
- Problem: Envoy supports various service discovery methods. If the chosen method doesn't correctly resolve upstream instances (e.g., a
STRICT_DNScluster isn't resolving, or anEDS(Endpoint Discovery Service) server isn't providing correct endpoints), Envoy won't know where to send requests. - Diagnosis: Check the
typeandhosts(for static/DNS) oreds_cluster_name(for EDS) in your cluster config. Examine Envoy's logs for service discovery errors. - Fix: Ensure your service discovery mechanism is correctly configured and operational.
- Problem: Envoy supports various service discovery methods. If the chosen method doesn't correctly resolve upstream instances (e.g., a
- Outlier Detection:
- Problem: Envoy's outlier detection automatically ejects unhealthy hosts from the load balancing pool based on observed failures (e.g., too many 5xx errors, consecutive gateway errors, high latency). If configured too aggressively, it can prematurely remove healthy services.
- Diagnosis: Review the
outlier_detectionsection in your cluster configuration (e.g.,consecutive_5xx,interval,base_ejection_time). Check Envoy logs for messages about host ejection. - Fix: Adjust outlier detection parameters to balance responsiveness with stability.
5. Custom API Gateway Solutions / APIPark
Many organizations leverage open-source or custom-built API gateway solutions, or comprehensive platforms like APIPark. The general troubleshooting principles apply, but the specifics depend on the platform's architecture.
- Applying General Principles: For any custom or open-source API gateway, trace the request flow:
- How does it discover upstreams? (Static config, Consul, Eureka, Kubernetes API?)
- How does it perform health checks? (Periodic HTTP calls, TCP checks, custom scripts?)
- How does it manage the pool of healthy upstreams?
- What are its internal logging mechanisms?
- Leveraging APIPark's Capabilities: APIPark is an excellent example of an open-source AI gateway and API management platform that aims to simplify the complexities of API deployment and management. When troubleshooting "No Healthy Upstream" with APIPark, you would leverage its built-in features:
- Unified API Format & Lifecycle Management: Ensure that the API definitions within APIPark correctly point to the backend services. Misconfigurations in routing rules or service endpoints registered in APIPark would directly lead to this error.
- Detailed API Call Logging: APIPark provides comprehensive logging. This is your primary diagnostic tool. Look for logs related to connection failures, timeouts, or health check failures for specific APIs or backend services. The error messages in these logs will guide you to the root cause (e.g., "connection refused," "upstream service unavailable").
- Powerful Data Analysis: APIPark's analytics can reveal trends in connection failures or increased latency towards specific upstreams, hinting at intermittent health issues before they become full outages.
- Configuration in APIPark: If you're using APIPark to manage your APIs, you'll need to check how the backend services are defined and associated with your APIs. Ensure the hostnames, IP addresses, and ports configured for your backend services within APIPark's management interface are accurate and accessible from where APIPark is deployed. Its role in simplifying integration and deployment also implies it handles the underlying routing and health checks to ensure your AI and REST services are always accessible. Thus, correctly configuring your backend services within APIPark is a direct way to prevent "No Healthy Upstream" scenarios.
By understanding the specific mechanisms of your chosen API gateway and leveraging its unique features, you can efficiently pinpoint and resolve "No Healthy Upstream" errors in even the most complex environments.
Prevention Strategies
While effective troubleshooting is crucial, preventing "No Healthy Upstream" errors from occurring in the first place is the ultimate goal. Proactive measures, robust system design, and continuous monitoring can significantly reduce the frequency and impact of these critical failures.
1. Robust Monitoring and Alerting
Comprehensive observability is your first line of defense against any service disruption, including upstream health issues.
- Monitor API Gateway Logs and Upstream Application Logs:
- Strategy: Implement centralized logging (e.g., ELK stack, Splunk, Graylog, cloud logging services) for both your API gateway and all upstream services.
- Focus: Look for patterns of connection errors, timeout messages,
5xxstatus codes from upstreams, health check failures, and any application-specific errors that indicate instability. - Automation: Set up automated parsing and analysis of these logs to trigger alerts.
- Health Check Status of Upstreams:
- Strategy: Directly monitor the outcome of the API gateway's or load balancer's health checks. Most gateways expose metrics about the health of their upstream pools.
- Alerting: Configure alerts for when a significant percentage (or all) of upstream instances for a critical API are marked unhealthy. This provides an early warning before "No Healthy Upstream" impacts end-users.
- Resource Utilization (CPU, Memory, Network I/O) on Both Gateway and Upstream:
- Strategy: Use infrastructure monitoring tools (e.g., Prometheus/Grafana, Datadog, New Relic, cloud monitoring dashboards) to track key resource metrics.
- Alerting: Set thresholds for high CPU, memory, or network utilization on both the API gateway and upstream servers. Spikes in these metrics often precede service degradation and unhealthiness.
- Latency and Error Rates:
- Strategy: Monitor the end-to-end latency of API requests, as well as the error rates (e.g.,
5xxresponses). - Alerting: Alert if latency exceeds acceptable thresholds or if error rates spike. These are direct indicators of user impact and can signal underlying upstream issues.
- Strategy: Monitor the end-to-end latency of API requests, as well as the error rates (e.g.,
2. Automated Scaling
Dynamically adjusting resources to meet demand is vital in preventing resource exhaustion, a common cause of unhealthiness.
- Horizontal Scaling for Both API Gateway and Upstream Services:
- Strategy: Implement auto-scaling groups (AWS EC2 Auto Scaling, Azure VM Scale Sets, GCP Managed Instance Groups) or Kubernetes Horizontal Pod Autoscalers (HPA).
- Benefit: As traffic increases, new instances of the API gateway and upstream services are automatically provisioned, distributing the load and preventing any single instance from becoming overwhelmed and unhealthy. This ensures capacity matches demand, preventing resource-related "No Healthy Upstream" issues.
- Vertical Scaling (if horizontal isn't feasible/optimal):
- Strategy: For workloads that don't scale well horizontally or have specific resource requirements, monitor and proactively increase the CPU/memory of existing instances.
- Benefit: Prevents resource starvation on individual servers.
3. Graceful Shutdowns
Ensuring that backend services shut down cleanly is crucial for maintaining a healthy upstream pool.
- Strategy: Design applications to handle
SIGTERMsignals (or equivalent) gracefully. When a shutdown signal is received:- Stop accepting new connections.
- Mark themselves as unhealthy in health checks immediately (e.g., the
/healthendpoint starts returning 503). - Allow existing connections to drain or complete current requests within a timeout period.
- Clean up resources.
- Benefit: This prevents the API gateway from sending new requests to a service that is in the process of shutting down, reducing errors and ensuring a smooth transition during deployments or scaling events.
4. Circuit Breakers and Retries
These resilience patterns help clients and gateways handle transient failures gracefully.
- Implementing Circuit Breakers within the API Gateway or Client-Side:
- Strategy: A circuit breaker monitors calls to a service. If the failure rate crosses a threshold, the breaker "trips," short-circuiting subsequent calls for a period. Instead of making the call, it immediately returns an error (or a fallback response).
- Benefit: Prevents an API gateway (or a client) from continuously hammering an already failing upstream service, giving the upstream time to recover and preventing resource exhaustion on the gateway itself.
- Example: Envoy Proxy has built-in circuit breaking. Libraries like Hystrix (though deprecated, concept remains) or Resilience4j can be used client-side.
- Retries with Backoff:
- Strategy: When a transient error occurs (e.g., network glitch, temporary upstream overload), the client or API gateway can automatically retry the request after a short delay, often with an exponential backoff strategy.
- Benefit: Helps overcome intermittent "No Healthy Upstream" issues that are brief and self-correcting, improving perceived reliability without manual intervention.
- Caution: Only retry idempotent requests. Avoid aggressive retries that could worsen an already struggling upstream.
5. Thorough Testing
Rigorous testing is essential to uncover potential failure points before they impact production.
- Load Testing:
- Strategy: Simulate high traffic loads on your entire system, including the API gateway and upstream services.
- Benefit: Identify performance bottlenecks, resource limits, and breaking points that could lead to services becoming unhealthy under stress.
- Focus: Pay attention to how health checks behave under load and if "No Healthy Upstream" appears prematurely.
- Chaos Engineering:
- Strategy: Deliberately inject failures into your system (e.g., kill an upstream instance, introduce network latency, exhaust CPU) in a controlled environment.
- Benefit: Test the resilience of your API gateway and upstream services. Does the gateway correctly detect the unhealthy service? Does it reroute traffic? Does "No Healthy Upstream" propagate, or is it handled gracefully?
- Regular Health Check Verification:
- Strategy: Periodically review and test your health check endpoints. Ensure they are robust, accurately reflect service health, and respond quickly.
- Benefit: Prevents misconfigured or flaky health checks from causing false positives or negatives, which can directly lead to "No Healthy Upstream."
6. Documentation and Runbooks
When failures inevitably occur, clear procedures accelerate recovery.
- Strategy: Create detailed runbooks for common error scenarios, including "No Healthy Upstream."
- Content: Include:
- Step-by-step diagnostic procedures (similar to this guide).
- Contact points for different teams (network, application, infrastructure).
- Known fixes and workarounds.
- Expected recovery times.
- Benefit: Empowers on-call engineers to quickly diagnose and resolve issues, minimizing MTTR (Mean Time To Recovery).
By integrating these prevention strategies into your development, operations, and infrastructure management practices, you can build a more resilient system where "No Healthy Upstream" errors are rare, quickly detected, and efficiently resolved, ensuring continuous availability of your APIs.
Case Study: Nginx Gateway Showing 'No Healthy Upstream' for a Node.js Backend
Let's walk through a simplified scenario to illustrate the troubleshooting steps in practice.
Scenario: A development team has deployed a new Node.js microservice (user-profile-service) behind an Nginx API gateway. Initially, everything works fine. However, after a few days, users start reporting intermittent 502 Bad Gateway errors, and the Nginx error logs show: "no live upstreams while connecting to upstream".
Initial Observations:
- API Gateway: Nginx, running on a Linux VM.
- Upstream: Node.js application, running as a systemd service on another Linux VM.
- Network: Both VMs are in the same private subnet.
- Error: Intermittent
502 Bad Gatewayfrom Nginx, with "no live upstreams" in logs.
Step-by-Step Diagnosis:
Phase 1: Initial Diagnosis and Verification
- Connectivity Checks (from Nginx VM to Node.js VM):
- Action:
ping 192.168.1.10(Node.js VM IP). - Result: Pings succeed with low latency (e.g.,
time=0.5ms). Conclusion: Basic IP connectivity is fine. - Action:
telnet 192.168.1.10 3000(Node.js service port). - Result: Connection
refusedintermittently. Sometimes it connects, sometimes not. Conclusion: This is suspicious. The service isn't always listening or is dropping connections. - Action: Briefly check firewall on both VMs using
sudo iptables -L(Linux) and security groups in the cloud console. - Result: No obvious blocks for port 3000 between the two VMs. Conclusion: Firewalls are unlikely the primary cause of intermittent refusal.
- Action:
- Upstream Server Status (on Node.js VM):
- Action:
systemctl status user-profile-service. - Result: Service shows
active (running). No recent restarts. Conclusion: Application is technically running. - Action:
tail -f /var/log/syslogand application's specific logs (e.g.,/opt/user-profile-service/logs/app.log). - Result (Key Finding): Logs show frequent
Error: listen EADDRINUSE: address already in use :::3000messages immediately followed byApplication starting on port 3000. This is happening cyclically. - Root Cause Identified: The Node.js application is repeatedly trying to start on port 3000, but something else is holding the port (or it's not releasing it cleanly). It briefly becomes available, then crashes and tries again, leading to intermittent availability.
- Action:
Further Investigation on Node.js VM (due to EADDRINUSE):
- Action:
sudo lsof -i :3000 - Result (Key Finding): Multiple
nodeprocesses are sometimes listed, or a process holds the port even after thesystemctl statusclaims the service is running. This indicates the Node.js application is not handling restarts cleanly, or a deployment artifact is causing multiple instances to spin up.
Phase 2: Health Checks and Load Balancing (Nginx perspective after initial finding)
Even though the root cause seems to be on the upstream, it's worth checking Nginx's health check configuration to understand why it's marking it unhealthy.
Nginx Configuration (/etc/nginx/conf.d/user_profile.conf):
upstream user_profile_backends {
    server 192.168.1.10:3000 max_fails=3 fail_timeout=10s;
    # No explicit health_check directive is present, relying on default passive checks
}

server {
    listen 80;
    server_name api.example.com;

    location /profile/ {
        proxy_pass http://user_profile_backends;
        proxy_set_header Host $host;
        proxy_set_header X-Real-IP $remote_addr;
        proxy_connect_timeout 2s; # Nginx connection timeout
        proxy_read_timeout 10s;   # Nginx read timeout
    }
}
- Analysis: Nginx is using passive health checks (implicitly with
max_failsandfail_timeout). When the Node.js service intermittently refuses connections, Nginx quickly hitsmax_fails=3withinfail_timeout=10s, marks the upstream as unhealthy, and removes it. Because there's only one upstream server, it then reports "no live upstreams." Theproxy_connect_timeout 2sis also relatively short, contributing to quick failure detection when the Node.js app is busy restarting.
Resolution Plan:
- Address the Node.js application's
EADDRINUSEissue:- Investigate the Node.js application's startup script or process manager configuration. Ensure it cleanly releases ports on shutdown/restart.
- Possibly switch to a more robust process manager (e.g., PM2 for Node.js) or fix the underlying code causing the port conflict or improper shutdown.
- Ensure there aren't multiple instances of the application trying to bind to the same port.
- Improve Nginx resilience (optional but recommended):
- Add more upstream instances: If the
user-profile-servicewere deployed with multiple instances (e.g.,server 192.168.1.10:3000; server 192.168.1.11:3000;), Nginx could route to another healthy instance when one fails, mitigating the impact of a single unhealthy upstream. - Adjust
fail_timeoutandmax_fails: If the intermittent failures are very short-lived, slightly increasingfail_timeoutcould prevent Nginx from marking the service unhealthy too quickly. - Implement active health checks (if applicable): For more complex scenarios, an explicit
health_checkdirective (with Nginx Plus or third-party modules) to a dedicated/healthendpoint would provide more granular control.
- Add more upstream instances: If the
Outcome: After fixing the Node.js application's port binding issue and ensuring clean shutdowns, the EADDRINUSE errors ceased. The Node.js service remained consistently online. As a result, Nginx no longer saw connection refusals from the upstream, and the "no live upstreams" error disappeared. Users reported no more 502 Bad Gateway issues.
This case study highlights how an apparently complex "No Healthy Upstream" error can often be traced back to fundamental application health issues, and how a systematic diagnostic approach reveals the root cause.
Table: Common Diagnostics for 'No Healthy Upstream'
This table summarizes key diagnostic actions, their purpose, and common findings related to the 'No Healthy Upstream' error.
| Category | Diagnostic Action | Purpose | Common Findings & Implications |
|---|---|---|---|
| Network Connectivity | ping <upstream_ip> (from gateway) |
Verify basic IP reachability. | 100% packet loss -> Network path broken. High RTT -> Latency issue. 0% loss -> IP reachable, look deeper. |
traceroute <upstream_ip> (from gateway) |
Identify network hop where connection breaks or latency spikes. | Hop showing * * * or high latency -> Potential router/firewall issue at that point. |
|
telnet <upstream_ip> <port> (from gateway) |
Check if target port on upstream is open and listening. | Connection refused/timed out -> Port blocked by firewall, or application not listening. Connected -> Port open, look at application/health checks. |
|
| Check Firewall/Security Group Rules | Ensure network security allows traffic between gateway and upstream. | Rules blocking gateway_ip:any_port to upstream_ip:upstream_port. Incorrect inbound/outbound rules. |
|
| Upstream Service | systemctl status <service> / docker ps |
Verify the application is running on the upstream server. | inactive (dead) / Exited -> Application crashed or stopped. Restarting -> Application in a crash loop. |
| Review Upstream Application Logs | Find application-level errors causing unresponsiveness. | EADDRINUSE (port conflict), DB connection failed, OutOfMemoryError, unhandled exceptions. |
|
lsof -i :<port> (on upstream) |
Check which process is listening on the expected port. | No process listening, or wrong process, or multiple processes (port conflict). | |
| API Gateway Config | Review gateway.conf (e.g., Nginx, Envoy, HAProxy) |
Confirm upstream server addresses, ports, and health check settings are correct. | Typo in IP/hostname/port, incorrect protocol (HTTP vs HTTPS), missing upstream block, proxy_pass points to wrong target. |
Check DNS resolution (dig <hostname>) |
Ensure upstream hostnames resolve correctly from gateway. | NXDOMAIN (non-existent domain), resolves to incorrect IP, or old cached IP. |
|
| Health Checks | Review health_check settings in gateway config |
Verify health check type, path, interval, timeout, thresholds. | Health check path (/health) is wrong, timeout too short, interval too long/short, expecting wrong HTTP status code. |
| Test Upstream Health Check Endpoint Directly | Validate the upstream's health check returns expected response. | Returns 404 (endpoint not found), 500 (internal error), or hangs/times out, even when app is somewhat functional. |
|
| Resource Limits | top, htop, free -h (on gateway and upstream) |
Monitor CPU, memory, and general process activity. | Consistently high CPU/memory utilization, processes stuck, system swapping to disk. Indicates resource starvation. |
iostat -xz 1 (on gateway and upstream) |
Check disk I/O performance. | High %util or wait times -> Disk bottleneck impacting application/logs. |
|
netstat -nat (on gateway and upstream) |
Examine network connections, especially TIME_WAIT states. |
Excessive TIME_WAIT connections (on gateway) -> Ephemeral port exhaustion. Low ESTABLISHED (on upstream) -> Not accepting connections. |
|
ulimit -n / lsof | wc -l (on gateway and upstream) |
Check open file descriptor limits. | Current lsof count close to or exceeding ulimit -n -> Cannot open new connections/files. |
|
| Kubernetes Specific | kubectl describe pod <upstream_pod> |
Check Liveness/Readiness probe status and events. | Readiness probe failed / Liveness probe failed events, indicating the pod isn't ready for traffic or is crashing. |
kubectl get ep <service_name> |
Verify service endpoints are correctly pointing to healthy pods. | Endpoint list is empty or contains wrong IPs/ports. | |
| Cloud Gateways | Cloud Console Integration Settings | Verify backend target, VPC Links, IAM permissions. | Incorrect Lambda ARN, wrong HTTP endpoint, VPC Link inactive, missing IAM permissions to invoke backend. |
| Cloud Logs (CloudWatch, Azure Monitor) | Examine gateway and backend service logs for specific integration errors. | Permission denied, Endpoint unreachable, Internal server error from backend. |
|
| APIPark Specific | APIPark Detailed API Call Logging | Review specific call logs for errors originating from the backend service integration. | Connection timeouts, HTTP 5xx errors from upstream, health check failures as observed by the platform. |
| APIPark Data Analysis | Identify trends in performance or error rates pointing to upstream degradation. | Gradual increase in backend latency, spike in 5xx errors before a full No Healthy Upstream event. |
Conclusion
The "No Healthy Upstream" error, while a formidable challenge, is far from insurmountable. It serves as a stark reminder of the intricate dependencies within modern distributed systems, particularly those relying on robust API gateways to orchestrate communication between services. Through this extensive exploration, we have dissected the error's fundamental meaning, its architectural context, and a multi-phased approach to its diagnosis and resolution.
We began by emphasizing the importance of foundational checks – verifying basic network connectivity, confirming the operational status of upstream applications, and meticulously auditing API gateway configurations. Many issues, often surprisingly simple, are resolved at this initial stage. We then delved into the critical role of health checks and load balancing, highlighting how subtle misconfigurations in these mechanisms can mislead a gateway into prematurely declaring an upstream unhealthy. Further, we navigated the complexities of network infrastructure and resource management, acknowledging that an upstream might be technically "up" but practically "unhealthy" due to resource exhaustion or underlying network degradations. Finally, we addressed advanced scenarios specific to containerized environments, cloud-managed API gateways, and other popular proxy implementations, providing tailored advice for each. We specifically highlighted how comprehensive platforms like APIPark simplify API management and provide essential tools, such as detailed logging and data analysis, which are invaluable for quickly pinpointing the root causes of upstream health issues.
Prevention, as always, is superior to cure. By adopting proactive strategies such as robust monitoring and alerting, implementing automated scaling, designing for graceful shutdowns, leveraging resilience patterns like circuit breakers, and conducting thorough testing, organizations can significantly enhance the stability and availability of their APIs. When an API gateway signals "No Healthy Upstream," it's not a dead end but an invitation to apply a systematic, expert approach. Armed with the knowledge and techniques outlined in this guide, developers and operations teams can confidently troubleshoot these critical errors, ensuring their APIs remain the reliable backbone of their digital ecosystems.
FAQ: Troubleshooting 'No Healthy Upstream'
1. What does 'No Healthy Upstream' fundamentally mean, and why is it a critical error? 'No Healthy Upstream' means that the API gateway or reverse proxy responsible for directing client requests to your backend services cannot find any of its configured backend instances that are deemed "healthy" and ready to receive traffic. It's a critical error because it signifies a complete inability to serve requests for the affected APIs, leading to service outages, frustrated users, and direct business impact. It's the gateway's way of saying, "I have no one to talk to."
2. What are the most common initial checks when I encounter 'No Healthy Upstream'? Begin with the basics: * Connectivity: From the API gateway server, ping the upstream server's IP and telnet to its application port (e.g., telnet <upstream_ip> <port>). This verifies network reachability and port availability. * Upstream Status: Log in to the upstream server and confirm the application is running (systemctl status <service>, docker ps) and check its application logs for any startup errors or crashes. * Gateway Configuration: Review your API gateway configuration (e.g., Nginx upstream blocks, Envoy clusters) to ensure the upstream server's IP address, port, and protocol are precisely correct. A simple typo can be the culprit.
3. How do health checks play a role in this error, and what are common health check pitfalls? Health checks are periodic probes sent by the API gateway to determine if an upstream instance is operational. If enough checks fail, the gateway marks the instance unhealthy. Common pitfalls include: * Incorrect health check endpoint: The backend API doesn't expose a /health endpoint, or it returns an incorrect HTTP status code (e.g., 404, 500 instead of 200 OK). * Insufficient timeout: The health check timeout is too short, causing legitimate but slightly slow responses to be marked as failures due to network latency or temporary upstream load. * Firewall blocking: Firewalls (OS-level, network-level, or cloud security groups) block the API gateway's health check probes. * Flaky health check logic: The health endpoint itself is unstable or performs too many internal checks, causing it to randomly fail.
4. Can resource exhaustion on the backend or gateway cause 'No Healthy Upstream'? Absolutely. Resource exhaustion is a frequent underlying cause. * On the Upstream: If the backend service runs out of CPU, memory, open file descriptors, or database connections, it can become unresponsive or crash, leading the API gateway to mark it unhealthy. Monitoring tools like top, htop, free -h, and application-specific logs are crucial here. * On the Gateway: If the API gateway itself is overloaded with too many connections, exhausts its ephemeral ports, or runs out of CPU/memory, it might be unable to establish new connections to upstreams or even run its health checks effectively, resulting in the error.
5. How can I prevent 'No Healthy Upstream' errors in a Kubernetes environment? In Kubernetes, preventing this error largely revolves around proper container and service health management: * Robust readiness probes: Ensure your backend service pods have well-configured and accurate readiness probes that truly reflect whether the application is ready to handle traffic. If a readiness probe fails, Kubernetes will remove the pod from service endpoints, preventing the Ingress Controller or API gateway from routing traffic to it. * Liveness probes: While less direct, failing liveness probes lead to pod restarts. A pod in a crash loop will never become ready. * Service & Endpoints: Verify that your Kubernetes Service objects correctly select your pods and that the Endpoint objects (which define where the service directs traffic) are up-to-date and contain healthy pod IPs. * Network Policies: Ensure no network policies are inadvertently blocking communication between your API gateway (or Ingress Controller) and your backend service pods.
🚀You can securely and efficiently call the OpenAI API on APIPark in just two steps:
Step 1: Deploy the APIPark AI gateway in 5 minutes.
APIPark is developed based on Golang, offering strong product performance and low development and maintenance costs. You can deploy APIPark with a single command line.
curl -sSO https://download.apipark.com/install/quick-start.sh; bash quick-start.sh

In my experience, you can see the successful deployment interface within 5 to 10 minutes. Then, you can log in to APIPark using your account.

Step 2: Call the OpenAI API.