Understanding & Fixing Upstream Request Timeout Errors


In the intricate tapestry of modern distributed systems, where myriad services communicate ceaselessly, the seamless flow of data is paramount. At the heart of many such architectures lies the API gateway, a critical traffic cop that directs requests to their intended destinations. While these gateways streamline communication, they also introduce a potential point of failure: the dreaded upstream request timeout. This issue, often manifesting as slow responses or outright service unavailability, can severely degrade user experience, impact business operations, and erode trust in an application's reliability. It is a nuanced problem, rarely stemming from a single, isolated cause, but rather from a complex interplay of factors ranging from code inefficiencies to network congestion.
Navigating the labyrinth of upstream request timeouts requires a deep understanding of the entire request lifecycle, from the initial client query to the final response from the backend service. It demands meticulous diagnostics, a systematic approach to root cause analysis, and the implementation of robust strategies for prevention and remediation. This comprehensive guide will delve into the anatomy of an upstream request timeout, dissect its common culprits, equip you with powerful diagnostic tools, and outline practical, actionable steps to not only resolve existing issues but also fortify your systems against future occurrences. By mastering the art of troubleshooting these elusive errors, developers, operations teams, and architects alike can significantly enhance the stability, performance, and overall resilience of their API-driven applications. Our journey will cover everything from optimizing individual API endpoints to fine-tuning the gateway itself, ensuring your services remain responsive and reliable, even under the most demanding conditions.
I. What Exactly is an Upstream Request Timeout?
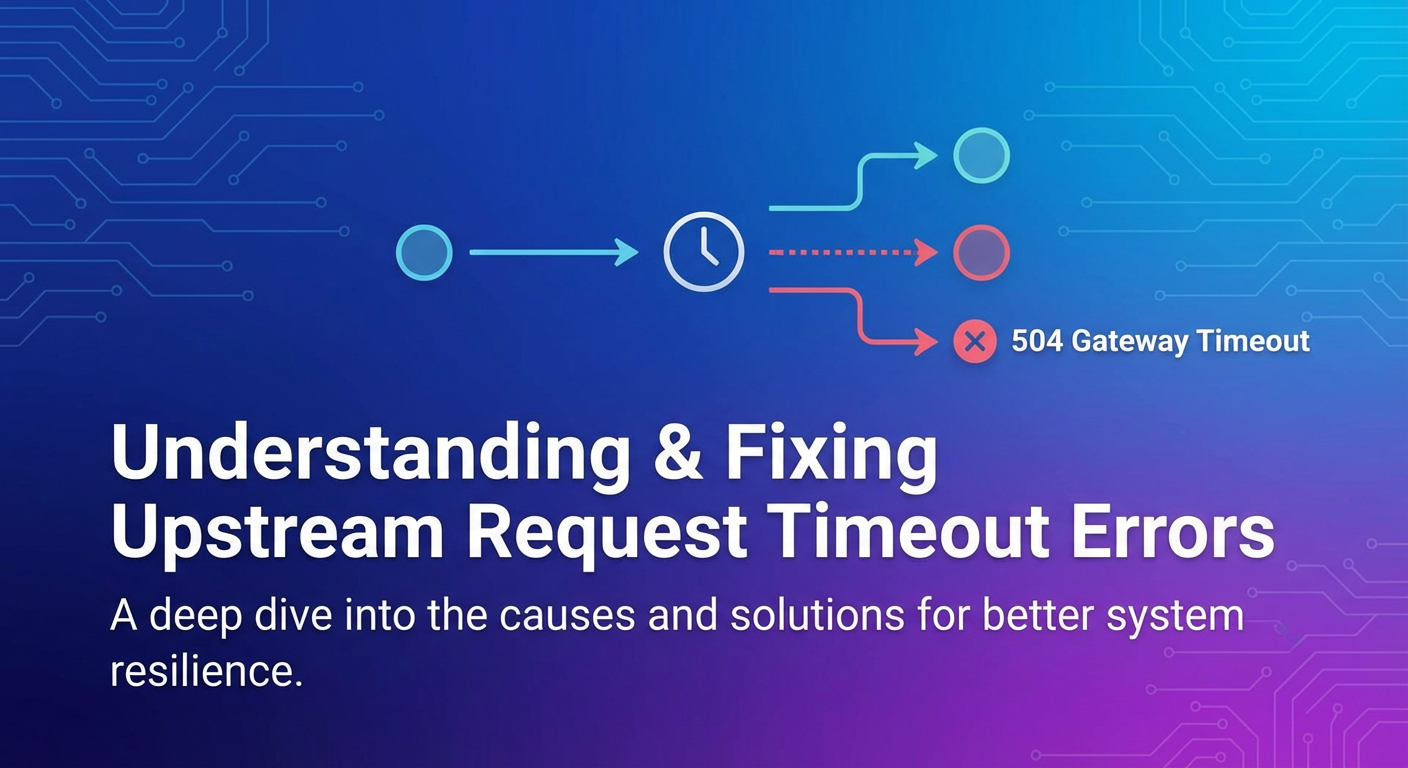
At its core, an upstream request timeout signifies a communication breakdown where a service, typically an API gateway, fails to receive a response from its designated backend service (the "upstream") within a predefined period. Imagine a customer placing an order through an e-commerce website. The customer's request first hits the web server or an API gateway. This gateway then forwards the request to various internal services—perhaps an inventory API to check stock, a payment API to process the transaction, and a shipping API to arrange delivery. Each of these internal services is considered an "upstream" from the perspective of the API gateway. If the inventory API, for instance, takes too long to respond to the gateway's query, exceeding the allocated wait time, the gateway will terminate the connection and return a timeout error, often a 504 Gateway Timeout or 502 Bad Gateway, back to the customer.
This "timeout" is not merely an arbitrary waiting period; it's a crucial mechanism designed to prevent requests from hanging indefinitely, consuming valuable system resources, and cascading failures across the entire architecture. Without timeouts, a single unresponsive upstream service could tie up connections on the gateway indefinitely, eventually exhausting its connection pool and causing subsequent requests for all services to fail. The specific duration of this waiting period is a configurable parameter, set at various layers of the application stack, from the client-side API call to the API gateway and even within the upstream service itself when it makes its own external calls.
It's vital to distinguish an upstream request timeout from other common API errors. A 500 Internal Server Error typically indicates that the upstream service received the request but encountered an unhandled exception or bug during processing. A 503 Service Unavailable suggests the upstream service is temporarily unable to handle the request, often due to maintenance or overload, but the connection was still established. A 408 Request Timeout, while similar in name, usually implies the client waited too long for a response from the server, which could be the API gateway itself, not necessarily an upstream service. An upstream request timeout, therefore, specifically points to a bottleneck or failure in the communication between the API gateway (or any intermediary service) and the ultimate backend API that is responsible for fulfilling the request. The immediate consequence is a frustrating experience for the end-user, who might perceive the entire application as slow or broken, regardless of where the actual delay originated. For system administrators and developers, it signals an urgent need to investigate the performance and health of the backend services and the network paths connecting them.
II. The Architecture of API Communication: A Closer Look
Understanding upstream request timeouts requires a holistic view of the communication chain, which often involves multiple layers, each with its own responsibilities and potential points of failure. The journey of an API request is rarely direct; it typically traverses several components before reaching its final destination and returning a response.
A. The Client: The Initiator of the Request
The client is the starting point of any API interaction. This could be a web browser, a mobile application, a command-line tool, or even another backend service. The client initiates the request, specifies the desired API endpoint, and includes any necessary data or authentication credentials. From the client's perspective, the primary concern is receiving a timely and accurate response. If a response is not received within its own configured timeout period, the client itself might register a timeout error, often before the gateway or upstream service even has a chance to fully process the request or report its own timeout. This client-side timeout can sometimes mask the true upstream issue, making initial diagnosis more challenging. Therefore, correlating client-side logs with gateway and upstream logs is crucial for pinpointing the exact point of failure.
B. The API Gateway: The Intelligent Traffic Cop
The API gateway stands as a pivotal component in modern microservices architectures. It acts as a single entry point for all client requests, abstracting the complexities of the underlying backend services. More than just a simple reverse proxy, a robust gateway often provides a suite of functionalities:
- Request Routing: Directing incoming requests to the appropriate backend service based on predefined rules.
- Load Balancing: Distributing requests across multiple instances of an upstream service to ensure high availability and optimal resource utilization.
- Authentication and Authorization: Enforcing security policies, validating
APIkeys, and managing access permissions. - Rate Limiting: Protecting backend services from being overwhelmed by too many requests.
- Caching: Storing responses to frequently accessed data to reduce load on upstream services and improve response times.
- Transformation: Modifying requests or responses on the fly to suit different client or service needs.
- Monitoring and Logging: Providing observability into
APItraffic, performance, and errors.
Crucially, the API gateway is where key timeout configurations are often defined. These include the client-to-gateway timeout (how long the gateway waits for a complete request from the client) and, most importantly for our topic, the gateway-to-upstream timeout (how long the gateway waits for a response from the backend API service). If this latter timeout expires, the gateway is responsible for generating and returning an appropriate error (e.g., 504 Gateway Timeout) to the client. Because of its central position, the gateway is often the first component to detect and report an upstream timeout, making its logs indispensable for initial troubleshooting. Configuring these timeouts thoughtfully within the gateway is a delicate balancing act: too short, and legitimate slow operations might time out; too long, and resources can be needlessly tied up. Solutions like APIPark offer comprehensive API management capabilities, including sophisticated configuration options for managing traffic, load balancing, and meticulously setting timeouts, thus providing granular control over how requests are routed and handled to prevent such errors. This helps ensure that your APIs remain responsive and reliable, even under varying load conditions, by providing a robust framework for API lifecycle management and performance optimization.
C. Upstream Services (Backend APIs/Microservices): The Business Logic Providers
The upstream services are the true workhorses of the application. These are the individual APIs or microservices responsible for executing specific business logic—fetching data from a database, performing complex calculations, integrating with third-party systems, or processing transactions. They are the ultimate source of the data or functionality that the client is requesting. In a microservices architecture, there could be dozens or even hundreds of these services, each specialized for a particular task.
When an upstream service receives a request from the API gateway, it begins its processing. This might involve:
- Querying one or more databases.
- Making calls to other internal services.
- Invoking external third-party
APIs. - Performing intensive computational tasks.
- Accessing file systems or message queues.
Any delay or bottleneck within these operations, if it exceeds the API gateway's configured timeout, will result in an upstream request timeout. The challenge often lies in identifying which part of the upstream service's internal processing is causing the delay. Performance issues within these services are the most frequent root cause of timeouts, stemming from inefficient code, resource contention, or slow external dependencies.
D. Network Infrastructure: The Invisible Pathways
Connecting the client, the API gateway, and the upstream services is the underlying network infrastructure. This encompasses a vast array of components: physical cables, routers, switches, firewalls, load balancers, DNS servers, and potentially multiple data centers or cloud regions. While often overlooked, network issues can be a significant contributor to upstream request timeouts.
Factors such as:
- Network Latency: The time it takes for data packets to travel between components. High latency can add considerable overhead to every request.
- Bandwidth Limitations: Insufficient network capacity can lead to congestion, causing packets to be dropped or delayed.
- Firewall Rules: Misconfigured firewalls might introduce delays as packets are inspected, or even block legitimate traffic entirely, leading to perceived timeouts.
- Load Balancer Issues: An overloaded or misconfigured load balancer between the
API gatewayand upstream services can fail to distribute traffic effectively or become a bottleneck itself. - DNS Resolution Problems: Delays in resolving service hostnames to IP addresses can add initial latency to connections.
- Packet Loss: Network instability can lead to data packets not reaching their destination, requiring retransmissions and delaying the overall response.
Diagnosing network-related timeouts often requires specialized tools and expertise, as these issues can be intermittent and difficult to reproduce. However, they are a critical piece of the puzzle when troubleshooting persistent upstream timeout errors, especially in geographically distributed systems or complex cloud environments.
III. Common Causes of Upstream Request Timeouts (Root Cause Analysis)
Understanding the architecture provides the landscape, but pinpointing the specific causes of upstream request timeouts requires digging deeper into the potential bottlenecks at each layer. These errors rarely appear without reason; they are symptoms of underlying systemic issues.
A. Upstream Service Overload/Resource Exhaustion
This is arguably the most common culprit. When an upstream service receives more requests than it can handle, or if its existing requests become overly demanding, its resources can quickly become depleted, leading to a significant slowdown or complete unresponsiveness.
- CPU Bottlenecks: Intensive computations, complex data processing, or poorly optimized loops can max out CPU cores, leaving insufficient processing power for new or pending requests.
- Memory Exhaustion: Services with memory leaks, large in-memory caches, or handling very large datasets can consume all available RAM, leading to swapping (using disk as virtual memory), which is significantly slower, or even OutOfMemory errors, causing the service to crash or become unresponsive.
- Disk I/O Bottlenecks: Services that frequently read from or write to disk, especially those relying on slow storage, can become I/O bound. This is particularly prevalent in database-heavy applications where disk operations are critical.
- Database Contention/Deadlocks: If multiple concurrent requests attempt to access or modify the same database records, contention can arise. This leads to queries waiting for locks to be released, or in severe cases, deadlocks where two or more transactions are permanently blocked, each waiting for the other to release a lock. Both scenarios can significantly delay database operations and thus the entire
APIresponse. - Thread Pool Exhaustion: Many
APIservices, especially those built on frameworks like Java Spring Boot or Node.js with worker threads, rely on a limited pool of threads to handle incoming requests. If all threads are busy processing long-running operations, new requests will queue up, waiting for an available thread. If the queue grows too large, or if individual requests take too long to free up a thread, theAPI gateway's timeout will be triggered. - Queue Buildup: Beyond thread pools, if a service uses internal message queues or asynchronous processing queues, a sudden spike in messages or a slowdown in message processing can cause these queues to back up, delaying the eventual processing of requests.
- External Dependencies: Even if the core service is efficient, if it relies on a slow external
APIor an unresponsive database, that dependency can become the bottleneck, causing the service itself to appear slow.
B. Slow or Inefficient Upstream Service Logic
Sometimes, the problem isn't about capacity, but about the inherent inefficiency of the code within the upstream service itself.
- Complex Database Queries: Poorly written SQL queries that lack proper indexes, involve large joins, or perform full table scans on large datasets can take an excessively long time to execute. This is a classic source of latency.
- Inefficient Algorithms: The chosen algorithm for a particular task might scale poorly with increasing data volumes. For instance, an O(n^2) algorithm might be acceptable for small datasets but will become a major bottleneck for large inputs, leading to processing times that exceed timeouts.
- Synchronous Long-Running Operations: Performing computationally intensive tasks or interacting with slow external services synchronously means that the
APIrequest thread is blocked until that operation completes. This ties up resources and prevents the thread from serving other requests, leading to timeouts under load. - Memory Leaks Leading to Gradual Performance Degradation: While related to memory exhaustion, memory leaks are more insidious. They cause a service to slowly consume more and more memory over time, not immediately leading to a crash but gradually slowing down performance as the operating system resorts to swapping and garbage collection becomes more frequent and expensive. This can lead to intermittent timeouts that worsen over time, often only resolved by a service restart.
C. Network Latency and Connectivity Issues
The physical and virtual network pathways are critical. Any impediment here can delay requests even if both the API gateway and the upstream service are performing optimally.
- Network Congestion between API Gateway and Upstream: High traffic volumes on the network segment connecting the
API gatewayto the upstream service can lead to packet delays or loss. This is common in shared network environments or when insufficient bandwidth is allocated. - Firewall Rules or Security Gateways Introducing Delays: Firewalls, intrusion detection/prevention systems, or other security appliances might perform deep packet inspection or other security checks that add measurable latency to each request. Misconfigured rules can also block connections outright, leading to timeouts.
- DNS Resolution Problems: Delays in resolving the hostname of the upstream service to an IP address can add initial latency to connection establishment. If DNS servers are slow or unresponsive, this can significantly impact the responsiveness of
APIcalls. - Load Balancer Misconfigurations: A load balancer that is incorrectly configured, overloaded, or experiencing health check failures might route traffic to unhealthy instances, or itself become a bottleneck, delaying requests before they even reach the upstream service.
- Physical Network Hardware Failures: Faulty network interface cards (NICs), cabling issues, or problems with routers and switches can lead to intermittent connectivity, packet loss, and increased latency. While less common in cloud environments, these can be critical in on-premise deployments.
D. Incorrect Timeout Configurations
Sometimes, the underlying services are fine, but the system is configured to be impatient.
- API Gateway Timeout Set Too Low for the Upstream Operation: The most straightforward cause. If an upstream operation legitimately takes 15 seconds, but the
API gatewayis configured to timeout after 10 seconds, legitimate requests will fail. This often happens when developers are unaware of the typical execution time of specific backend tasks. - Upstream Service Itself Having Internal Timeouts: An upstream service might make its own calls to databases or other external
APIs. If these internal calls have their own, often shorter, timeouts, the upstream service might fail internally before it can respond to theAPI gateway. - Different Layers Having Different Timeout Values: In complex architectures, there can be multiple layers (client, load balancer,
API gateway, internal service proxy, actual service). If these layers have inconsistent timeout configurations (e.g.,gatewaytimeout > internal proxy timeout > service database query timeout), one layer might time out before another can, leading to confusing error messages or cascading failures. - Client-Side Timeouts: While not strictly an "upstream" timeout, if the client application has a very aggressive timeout, it might abandon the request before the
API gatewayeven has a chance to report an upstream timeout. This can lead to a client perceiving a timeout when thegatewayor upstream service was still actively processing the request.
E. External Dependencies and Third-Party APIs
Many modern applications rely heavily on external services (e.g., payment gateways, social media APIs, external data providers). When these dependencies falter, your service does too.
- Reliance on External Services That Are Slow or Unresponsive: If an upstream service makes a synchronous call to a third-party
APIthat is experiencing high latency or outages, the upstream service will be blocked, leading to a timeout for the client request. - Rate Limiting from External APIs: Third-party
APIs often impose rate limits to prevent abuse or overload. If your upstream service exceeds these limits, subsequent calls might be throttled or outright rejected, causing delays that lead to timeouts. - Cascading Failures from One Slow Dependency Affecting Others: A single slow external dependency can tie up resources in the calling upstream service, which in turn causes that upstream service to become slow and potentially trigger timeouts for the
API gateway, creating a chain reaction.
Identifying the specific cause of an upstream request timeout requires a systematic approach, combining monitoring, logging, and diagnostic tools to trace the request's journey and pinpoint where the delay originates.
IV. Diagnosing Upstream Request Timeouts: A Systematic Approach
When an upstream request timeout error surfaces, it's a call to action for immediate investigation. A systematic diagnostic approach is crucial to avoid chasing phantom problems and quickly pinpoint the root cause. This involves leveraging various tools and methodologies across different layers of your infrastructure.
A. Monitoring and Alerting
Proactive monitoring is your first line of defense. It allows you to detect issues early, sometimes even before users are significantly impacted, and provides historical data crucial for understanding trends.
- Key Metrics to Monitor:
- Latency: Track response times for
APIcalls, both at theAPI gatewaylevel and for individual upstream services. Spikes in latency are often precursors to timeouts. - Error Rates: Pay close attention to 5xx error rates, specifically 504 (Gateway Timeout) and 502 (Bad Gateway), which directly indicate upstream issues.
- Resource Utilization: Monitor CPU usage, memory consumption, disk I/O, and network I/O for both the
API gatewayand all upstream services. High utilization can signal an impending bottleneck. - Connection Pools: Monitor the state of database connection pools, thread pools, and any other resource pools. Exhaustion or high utilization here can cause delays.
- Queue Lengths: If using message queues or internal processing queues, monitor their lengths. Backlogs indicate slow processing.
- Latency: Track response times for
- Tools: Popular choices include Prometheus and Grafana for metrics collection and visualization, Datadog, New Relic, AppDynamics for end-to-end observability, and cloud-native solutions like AWS CloudWatch or Google Cloud Monitoring.
- Setting Up Alerts: Configure alerts for threshold breaches (e.g., 504 error rate > 1%, average latency > 500ms, CPU > 80%). Timely alerts notify the relevant teams immediately, minimizing downtime. Ensure alerts contain enough context (service name, metric, time) to kickstart the investigation.
B. Logging
Logs provide the granular details of what transpired during a request's lifecycle. Centralized logging is indispensable in distributed systems.
- Centralized Logging Systems: Tools like the ELK stack (Elasticsearch, Logstash, Kibana), Splunk, Logz.io, or Sumo Logic aggregate logs from all services, making them searchable and analyzable from a single interface.
- Correlating Request IDs: Implement a mechanism to pass a unique
request ID(also known as a correlation ID or trace ID) through every service involved in a singleAPItransaction. ThisIDshould be logged by the client,API gateway, and all upstream services. This allows you to trace a specific request's journey across multiple logs, crucial for understanding where it spent its time or failed. - Looking for Specific Error Messages: Search logs for keywords like "timeout," "connection refused," "socket hang up," "upstream timed out," "504," "502."
- Slow Query Logs: If the upstream service interacts with a database, enable and review slow query logs. These logs pinpoint database queries that take an unusually long time to execute, often a direct cause of timeouts.
- Tracing Tools for Distributed Systems: For complex microservices, distributed tracing tools like Jaeger, Zipkin, or OpenTelemetry provide a visual representation of a request's path through all services, showing the latency contributed by each hop. This makes it incredibly easy to identify which service in a chain is causing the delay.
C. Network Diagnostics
Sometimes, the issue isn't with the services themselves, but the invisible network plumbing connecting them.
pingandtraceroute/MTR: Usepingto check basic connectivity and latency between theAPI gatewayand the upstream service.traceroute(ortracerton Windows) andMTR(My Traceroute) help identify the network path and reveal where latency spikes or packet loss might be occurring between hops.tcpdumpor Wireshark: For deeper network analysis, these tools capture raw network packets. They can reveal if connections are being established correctly, if packets are being retransmitted, or if there's an unusual amount of traffic that could indicate congestion. This is an advanced technique but invaluable for diagnosing elusive network issues.- Checking Firewall Logs: Review firewall logs on both the
API gatewayand upstream service hosts (or network firewalls) to ensure no rules are blocking or delaying traffic. - Load Balancer Status: Check the health checks and status of any load balancers situated between the
API gatewayand upstream services. Ensure all backend instances are reported as healthy and are actively receiving traffic.
D. Resource Monitoring on Upstream Servers
If monitoring indicates high resource utilization, diving into the individual servers or containers running the upstream service is the next step.
top,htop,vmstat,iostat: These command-line utilities provide real-time snapshots of CPU usage, memory consumption, virtual memory activity, and disk I/O on Linux servers. They can quickly reveal if a specific process is consuming excessive resources.- Container/Orchestration Platform Metrics: If running in Docker, Kubernetes, or other container orchestration platforms, use their native monitoring tools (e.g.,
kubectl top pod, Docker stats) to check resource utilization at the container level. - Analyzing Historical Resource Usage Patterns: Look for correlations between timeout events and spikes in CPU, memory, or I/O. Are timeouts occurring during peak traffic? After a deployment? During specific background jobs?
E. Code Profiling
Once you've narrowed down the timeout to a specific upstream service and potentially a resource bottleneck, code profiling helps identify the exact lines of code or functions causing the delay.
- Language-Specific Profilers:
- Java: JProfiler, YourKit, VisualVM.
- Python:
cProfile,py-spy, line_profiler. - Node.js: Node.js built-in profiler, Chrome DevTools.
- Go:
pprof. - These tools analyze the execution time of different functions and methods within your application, identifying hot spots where the service spends most of its time.
- APM Tools Integration: Advanced Application Performance Management (APM) tools often include built-in profilers or transaction tracing capabilities that can pinpoint slow methods or database calls without manual instrumentation.
By systematically working through these diagnostic steps, starting from broad monitoring and narrowing down to specific code issues, you can efficiently identify the root cause of upstream request timeouts and formulate an effective remediation plan.
APIPark is a high-performance AI gateway that allows you to securely access the most comprehensive LLM APIs globally on the APIPark platform, including OpenAI, Anthropic, Mistral, Llama2, Google Gemini, and more.Try APIPark now! 👇👇👇
V. Strategies for Fixing Upstream Request Timeout Errors
Once the root cause of an upstream request timeout has been diagnosed, the next crucial step is to implement effective solutions. These strategies span across code optimization, infrastructure configuration, and architectural resilience patterns.
A. Optimizing Upstream Service Performance
The most direct way to prevent timeouts is to ensure your upstream services respond quickly and efficiently.
1. Code Optimization
- Refactor Inefficient Algorithms and Database Queries: Review code paths identified by profiling or slow query logs. Replace inefficient loops, data structures, or algorithms with more performant alternatives. For database queries, ensure proper indexing, avoid N+1 query problems, and optimize join operations. Use
EXPLAIN(in SQL databases) to analyze query plans. - Asynchronous Processing for Long-Running Tasks: For operations that naturally take a long time (e.g., generating complex reports, processing large files, sending emails), avoid blocking the
APIrequest thread. Instead, offload these tasks to background workers using message queues (e.g., RabbitMQ, Kafka, AWS SQS) or dedicated job schedulers. TheAPIcan then return an immediate "accepted" response with a status URL, allowing the client to poll for completion. - Caching Frequently Accessed Data: Implement caching mechanisms at various layers.
- In-memory cache: For data that changes infrequently and is accessed often within the service (e.g., configuration settings, lookup tables).
- Distributed cache: (e.g., Redis, Memcached) for data shared across multiple service instances or that can be quickly regenerated. This reduces the load on databases and other upstream dependencies.
- HTTP Caching: Leverage standard HTTP caching headers (e.g.,
Cache-Control,ETag) at theAPI gatewayor content delivery network (CDN) level.
- Memoization: A specific form of caching where the results of expensive function calls are stored and returned when the same inputs occur again. This is particularly useful for pure functions with high computational cost.
2. Database Performance Tuning
- Index Optimization: Ensure all frequently queried columns and columns used in
WHERE,JOIN,ORDER BYclauses have appropriate indexes. Regularly review and add/remove indexes based on query performance. - Query Review and Optimization: Beyond indexing, scrutinize the structure of your queries. Avoid
SELECT *, useLIMITclauses, and consider materialized views for complex, aggregate queries. - Connection Pooling: Configure database connection pools correctly. Too few connections can lead to waiting, too many can exhaust database resources. Balance
min-idleandmax-activeconnections based on typical load. - Read Replicas/Sharding: For read-heavy applications, offload read queries to database read replicas. For extremely large datasets or high write throughput, consider database sharding to distribute data and load across multiple database instances.
3. Resource Scaling (Vertical & Horizontal)
- Add More CPU/Memory (Vertical Scaling): If a service is consistently CPU-bound or memory-starved, upgrading the underlying instance (VM or container) with more CPU cores or RAM can provide immediate relief. This is often the quickest fix but has diminishing returns and cost implications.
- Add More Instances (Horizontal Scaling) with a Load Balancer: For stateless services, scaling out by adding more instances and distributing traffic among them using a load balancer is highly effective. This increases aggregate processing capacity and provides redundancy. Ensure your load balancer is configured to properly health-check and route traffic.
4. Efficient Resource Management
- Connection Pooling for External APIs and Databases: Beyond databases, implement connection pooling for other external dependencies (e.g., third-party
APIclients, message queue connections). Reusing connections reduces the overhead of establishing new ones. - Thread Pool Configuration: Fine-tune thread pool sizes for your application server or framework. Too small, and requests queue up; too large, and context switching overhead can degrade performance. Benchmark under load to find optimal settings.
B. Configuring Timeouts Appropriately
Timeout values are not one-size-fits-all. They must be carefully tuned to reflect the actual processing times of your services while preventing indefinite waits.
1. At the API Gateway Level
The API gateway's timeout configuration is paramount.
- Adjusting
proxy_read_timeout,proxy_send_timeout(Nginx) or equivalent: MostAPI gatewaysand reverse proxies offer parameters to control how long they wait for upstream responses. For Nginx,proxy_read_timeoutgoverns the time for reading a response from the upstream, whileproxy_send_timeoutcontrols the time for sending a request to the upstream. Similar settings exist in othergatewaysolutions (e.g., Kong, Envoy, Traefik). - Ensuring Gateway Timeout is Slightly Higher than Upstream Processing Time: The
gatewaytimeout should be set to a value that is reasonably longer than the expected maximum processing time of the slowest legitimate upstream operation. It should not be excessively long, as this defeats the purpose of timeouts (tying up resources). A common best practice is to set thegatewaytimeout to be slightly longer (e.g., 10-20%) than the longest acceptable response time of your upstreamAPIs. - Granular Control: Many advanced
API gatewaysolutions allow for different timeout settings perAPIroute or even perAPIoperation. This is critical for microservices, as a complex report generationAPImight legitimately need 60 seconds, while a simple data lookupAPIshould respond within 1 second. Robust API gateway solutions like APIPark offer sophisticated configuration options for managing timeouts and traffic, allowing for granular control over how requests are routed and handled to prevent such errors. This helps ensure that your APIs remain responsive and reliable, even under varying load conditions, by providing a robust framework for API lifecycle management and performance optimization.
2. At the Upstream Service Level
The upstream service itself might initiate external calls or have internal processing limits.
- Internal Application Timeouts for External Calls: If your upstream service calls other internal services or external third-party
APIs, ensure these internal client calls have their own sensible timeouts. If a sub-call times out, the upstream service should handle it gracefully, possibly with a fallback, rather than blocking indefinitely. - Web Server/Application Server Timeouts: Application servers (e.g., Gunicorn for Python, Tomcat for Java, uWSGI) typically have their own worker timeouts. Ensure these are aligned with the
API gatewaytimeouts.
3. Client-Side Timeouts
- Inform Clients about Appropriate Timeout Settings: While you control your backend, communicate recommended client-side timeout configurations to consumers of your
API. If a client has an aggressive 5-second timeout, but yourgatewayis configured for 30 seconds for a known slowAPI, the client will incorrectly perceive anAPIissue.
C. Implementing Resiliency Patterns
Resilience patterns help systems gracefully handle failures and slowdowns, reducing the impact of upstream timeouts.
1. Retries
- With Exponential Backoff for Transient Errors: For
APIcalls that fail due to transient network issues, temporary upstream overloads, or brief outages, implementing retries can increase success rates. Crucially, use exponential backoff (increasing wait time between retries) and jitter (adding random delay) to avoid overwhelming a recovering service. - Careful Implementation to Avoid Amplification: Only retry idempotent operations (operations that can be safely repeated without adverse side effects). Avoid retrying on non-transient errors (e.g., 400 Bad Request, 401 Unauthorized), and set a maximum number of retries to prevent request amplification during a prolonged outage.
2. Circuit Breakers
- Preventing Repeated Calls to Failing Services: A circuit breaker monitors calls to a service. If the error rate or timeout rate to that service exceeds a threshold, the circuit "trips," and subsequent calls are immediately failed without even attempting to connect to the struggling service.
- Failing Fast to Protect Upstream: This pattern prevents clients from continuously hammering a failing service, giving it time to recover and protecting downstream services from cascading failures. After a configurable "open" period, the circuit moves to a "half-open" state, allowing a small number of test requests to see if the service has recovered. Frameworks like Hystrix (though in maintenance mode) or libraries in resilience4j (Java), Polly (.NET), or Sentinel (Go) implement this.
3. Bulkheads
- Isolating Resources to Prevent One Failing Service from Taking Down Others: Similar to ship bulkheads, this pattern isolates resources (e.g., thread pools, connection pools) for different services or types of calls. If one service experiences issues and exhausts its allocated resources, it won't affect the resources available for other, healthy services, preventing cascading failures.
4. Timeouts and Deadlines (Advanced)
- Propagating Deadlines Across Service Boundaries: For very complex microservice chains, consider propagating a "deadline" (absolute time by which the client needs a response) rather than relative timeouts. Each service in the chain can then use the remaining time in the deadline to manage its own operations and sub-calls, failing early if the deadline is realistically unachievable.
D. Network Infrastructure Improvements
Address any network bottlenecks or misconfigurations.
- Reduce Latency:
- Co-locate Services: Deploy tightly coupled services in the same geographical region, availability zone, or even on the same hosts if practical, to minimize network hops and latency.
- Use Faster Network Hardware: Ensure your network infrastructure (switches, routers) is up to date and has sufficient capacity.
- Optimize DNS Resolution: Use fast, reliable DNS resolvers. Consider caching DNS queries at the
API gatewayor service level.
- Increase Bandwidth: Ensure sufficient network capacity between the
API gatewayand upstream services, especially if large data payloads are involved. - Review Firewall/Load Balancer Configuration: Regularly audit firewall rules to ensure they are optimal and not inadvertently introducing delays. Check load balancer settings for correct health checks, balancing algorithms, and session persistence (if needed).
E. Dependency Management and Third-Party API Handling
External dependencies are often out of your direct control, requiring specific strategies.
- Caching External Responses: Cache responses from third-party
APIs whenever possible, especially for data that doesn't change frequently. This reduces reliance on external services and improves response times. - Asynchronous Processing for External Calls: If an external
APIcall is known to be slow or unreliable, and its result isn't immediately critical for theAPIresponse, consider making the call asynchronously in a background worker. - Fallbacks: Provide graceful degradation or fallback mechanisms. If an external service is unavailable or times out, can you return a cached response, a default value, or a partial response? This maintains some level of functionality rather than a complete failure.
- Rate Limiting for Outgoing Calls: Implement client-side rate limiting when calling third-party
APIs to respect their usage limits and avoid being throttled or blocked. This is distinct from yourAPI gateway's ingress rate limiting.
By combining these strategies—optimizing individual services, configuring timeouts thoughtfully, building in resilience, and maintaining a robust network—you can significantly improve the reliability and performance of your API-driven applications, drastically reducing the occurrence and impact of upstream request timeout errors.
VI. Best Practices for Preventing Timeouts Proactively
While reactive troubleshooting is essential for addressing immediate crises, a proactive approach is key to building systems that are inherently more resilient to upstream request timeouts. These best practices focus on design, testing, and continuous operational vigilance.
A. Design for Failure (Resilience Engineering)
Embrace the philosophy that failures will happen, and design your systems to withstand them.
- Stateless Services: Where possible, design services to be stateless. This simplifies scaling, as any instance can handle any request, and makes services more resilient to individual instance failures, as there's no session data to lose.
- Idempotent Operations: Design
APIoperations to be idempotent, meaning that performing the operation multiple times has the same effect as performing it once. This is crucial for safe retries without unintended side effects (e.g., charging a customer twice). - Graceful Degradation: When a dependency fails or slows down, the system should gracefully degrade rather than collapse entirely. For example, if a recommendation engine is slow, the e-commerce site might still function by simply not showing recommendations, instead of timing out the entire product page load. This involves implementing fallbacks and prioritizing critical functionality.
- Loose Coupling: Minimize direct dependencies between services. Use asynchronous communication patterns (e.g., message queues) where appropriate, so a slow producer doesn't directly block a consumer.
B. Performance Testing and Load Testing
Identify bottlenecks and breaking points before they impact production users.
- Identify Bottlenecks Before Production: Incorporate performance testing into your continuous integration/continuous deployment (CI/CD) pipeline. Regularly test new features and deployments under realistic loads to catch performance regressions early.
- Stress Testing to Understand Breaking Points: Push your systems beyond their expected capacity to understand their true limits. How many concurrent users or requests can your
API gatewayhandle before it starts dropping requests or returning timeouts? What is the maximum sustainable throughput for your upstream services? This data informs scaling strategies and capacity planning. - Golden Metrics: Track key performance indicators (KPIs) during load tests, such as latency, throughput, error rates, and resource utilization (CPU, memory, network). Correlate these with increasing load to identify performance cliffs.
- Simulate Real-World Scenarios: Don't just simulate steady load. Test for traffic spikes, sudden increases in specific
APIcalls, and the failure of individual components to see how your system reacts.
C. Continuous Monitoring and Alerting
Even with robust design and testing, production environments are dynamic. Continuous monitoring is non-negotiable.
- Establish Baselines: Understand the normal performance characteristics of your
API gatewayand upstream services. What's typical latency during off-peak hours? What's the expected CPU utilization? These baselines are essential for identifying deviations. - Set Up Intelligent Alerts: Beyond simple threshold alerts (e.g., "CPU > 80%"), implement alerts based on rate of change, deviations from baseline, or composite metrics (e.g., "latency > 3x normal AND error rate > 0.5%"). Ensure alerts are actionable and routed to the correct teams.
- Distributed Tracing: As mentioned in diagnostics, actively use and analyze data from distributed tracing tools (Jaeger, Zipkin, OpenTelemetry). This provides invaluable visibility into latency across service boundaries in real-time, helping to pinpoint slow components or unexpected
APIcall paths before they lead to timeouts. - Dashboards and Visualizations: Create clear, intuitive dashboards that visualize key metrics and
APIhealth. Empower development and operations teams to quickly grasp the system's state and drill down into problem areas.
D. Regular Code Reviews and Optimization
Preventing timeouts starts with writing efficient code.
- Proactively Identify and Fix Inefficient Code: Incorporate performance considerations into code review processes. Look for common anti-patterns like N+1 queries, inefficient loops, excessive object creation, or unhandled resource leaks.
- Static Analysis Tools: Use static code analysis tools specific to your programming language (e.g., SonarQube, linters) to automatically identify potential performance issues, security vulnerabilities, and code quality problems.
- Performance Budgeting: For critical
APIs, define performance budgets (e.g., "thisAPImust respond within 200ms at the 99th percentile"). Design and test against these budgets.
E. Adherence to SRE Principles
Site Reliability Engineering (SRE) principles provide a framework for maintaining reliable systems at scale.
- Error Budgets: Define an "error budget" for each service – the maximum amount of downtime or unreliability you're willing to tolerate over a given period. If you exceed the budget, resources are shifted towards reliability work. This provides a data-driven approach to prioritize stability.
- SLIs (Service Level Indicators) and SLOs (Service Level Objectives): Clearly define what "good" service performance looks like (SLIs, e.g., latency, error rate) and set measurable targets (SLOs, e.g., 99.9% of requests must have latency < 500ms). Monitoring against these objectives helps proactively identify when services are trending towards unreliability.
- Blameless Postmortems: When timeouts or other failures occur, conduct blameless postmortems to understand the root cause, identify systemic weaknesses, and implement preventative measures without assigning individual blame. This fosters a culture of continuous learning and improvement.
By embedding these proactive best practices into your development and operations workflows, you can significantly reduce the likelihood and impact of upstream request timeout errors, leading to more stable, performant, and reliable API-driven applications.
VII. Case Study: The E-commerce Order Processing API Timeout
Let's illustrate the journey of an upstream request timeout with a practical scenario involving a hypothetical e-commerce platform.
Scenario: An online retail platform, "ShopFast," processes customer orders through a series of microservices orchestrated by an API gateway. When a customer clicks "Place Order," their request hits the main Order API endpoint on the gateway. This gateway then routes the request to several upstream services: 1. Inventory Service: To verify stock levels for each item. 2. Payment Service: To process the customer's payment. 3. Shipping Service: To create a shipping label and calculate delivery estimates. 4. Notification Service: To send an order confirmation email to the customer.
The API gateway for ShopFast is configured with a default upstream read timeout of 5 seconds.
The Problem: During a flash sale event, customers start experiencing "Order failed: Gateway Timeout" errors. Approximately 10% of order attempts are failing with a 504 Gateway Timeout.
Diagnosis - Step-by-Step:
- Monitoring Alert: The SRE team immediately receives an alert from Prometheus/Grafana: "504 Gateway Timeout error rate on
/ordersAPI endpoint > 5%." This is the first signal. The dashboard also shows a spike in average latency for the/ordersAPIjust before the errors started. - API Gateway Logs: The team examines the
API gateway(e.g., Nginx) logs. They see numerous entries likeupstream timed out (110: Connection timed out) while reading response from upstream. Therequest IDs in these logs are crucial. - Distributed Tracing (e.g., Jaeger): Using Jaeger, the team traces several failed requests. They observe that while the Payment Service and Notification Service respond within milliseconds, the
Inventory Servicecall is consistently taking 6-8 seconds, well over theAPI gateway's 5-second timeout. - Inventory Service Monitoring: They pivot to the monitoring dashboard for the
Inventory Service.- CPU and Memory: CPU utilization is at 95%, and memory consumption is creeping up.
- Database Connections: The connection pool to the inventory database is fully utilized, with many connections in a
WAITINGstate. - Request Queue: The internal request queue of the Inventory Service is backing up.
- Inventory Service Logs: The
Inventory Service's logs reveal frequent entries for "Slow database query: SELECT * FROM products WHERE product_id IN (...) FOR UPDATE." They also notice an increase inOutOfMemoryErrormessages from a few instances, indicating resource exhaustion. - Database Monitoring: The database team confirms high load on the inventory database, specifically on the
productstable. They identify a particularSELECT FOR UPDATEquery that is causing excessive locking and full table scans on a table with millions of items. An index that should have been used forproduct_idwas somehow missing or became inefficient after a recent schema change. - Code Profiling (on a test instance): A quick profile of the
Inventory Servicecode confirms that the majority of the time is spent waiting on the database call toSELECT FOR UPDATE.
Root Cause: The Inventory Service is experiencing a performance bottleneck primarily due to an inefficient database query that performs a full table scan and excessive locking on the products table. This, coupled with the high volume of requests during the flash sale, exhausted its CPU, memory, and database connection pool, causing individual API calls to take longer than the API gateway's 5-second timeout. The recent schema change likely broke an existing index.
Solutions Implemented:
- Database Optimization (Immediate Fix):
- A critical index was immediately re-added/optimized on the
product_idcolumn in theproductstable. This drastically reduced query execution time from 6-8 seconds to ~50ms. - The
SELECT FOR UPDATEquery was reviewed and optimized to acquire locks more judiciously or to use more granular locking where possible.
- A critical index was immediately re-added/optimized on the
- Horizontal Scaling (Short-term Relief):
- Additional instances of the
Inventory Servicewere quickly spun up, and theAPI gateway's load balancer automatically distributed traffic to them, alleviating the CPU and memory pressure on individual instances.
- Additional instances of the
- API Gateway Timeout Adjustment (Temporary, with caution):
- While the core issue was being fixed, the
API gateway's upstream timeout for the/ordersAPIwas temporarily increased from 5 seconds to 10 seconds. This allowed more legitimate orders to pass through while the database index was rebuilding and services were scaling. (Note: This is a temporary measure and should be reverted once the underlying performance is fixed, to prevent resource hogging).
- While the core issue was being fixed, the
- Resilience Pattern (Long-term Improvement):
- Caching: For less critical inventory checks (e.g., displaying stock on a product page, rather than placing an order), a Redis cache was introduced to store frequently viewed product stock levels, reducing direct database hits.
- Asynchronous Processing: For the
Notification Service, it was refactored to consume messages from a Kafka queue rather than being a direct synchronous call from theOrder API. This decoupled the order confirmation email from the critical order placement path. - Circuit Breaker: A circuit breaker was configured around the
Inventory Servicecalls from theOrder API. If theInventory Servicecontinued to be slow, the circuit would trip, allowing theOrder APIto fail fast with a more graceful error message, or potentially offer a "check inventory later" option, preventing theOrder APIitself from timing out indefinitely.
- Proactive Measures:
- Load Testing: Scheduled monthly load tests to proactively identify bottlenecks before sales events.
- Performance Monitoring Baselines: Updated monitoring alerts to track the
Inventory Service's database query times more closely. - CI/CD Integration: Implemented automated performance tests within the CI/CD pipeline to detect slow queries or performance regressions during schema changes or code deployments.
Outcome: The combination of database optimization and horizontal scaling quickly resolved the immediate timeout crisis. The long-term architectural improvements (caching, asynchronous processing, circuit breakers) significantly enhanced the overall resilience and performance of the e-commerce platform, making it better equipped to handle future traffic spikes and unexpected upstream delays. The incident also highlighted the critical role of the API gateway in identifying and, to some extent, mitigating these issues while providing a centralized point of control for API traffic.
The following table summarizes common timeout causes and their corresponding solutions:
| Category | Specific Cause | Diagnostic Clues | Remedial Action |
|---|---|---|---|
| Upstream Performance | Resource Exhaustion (CPU, Memory, I/O) | High CPU/Memory usage, OOM errors, Disk I/O waits in monitoring | Scale vertically (more resources) or horizontally (more instances) |
| Inefficient Code/Queries | Slow query logs, code profiler results, high database connection waits | Optimize algorithms, add database indexes, refactor inefficient queries, caching | |
| Thread Pool Exhaustion | Full thread pools in monitoring, request queue buildup | Tune thread pool size, offload long-running tasks asynchronously | |
| Network Issues | High Latency / Congestion | traceroute shows high RTT, packet loss, network congestion alerts |
Co-locate services, increase bandwidth, review network topology |
| Firewall / Load Balancer Bottlenecks | Firewall logs show drops/delays, load balancer health checks failing | Review firewall rules, optimize load balancer configuration, increase LB capacity | |
| Configuration | Incorrect Timeout Settings | API gateway logs show "upstream timed out" after X seconds precisely |
Adjust API gateway (e.g., proxy_read_timeout) and service-level timeouts |
| External Dependency | Slow/Unresponsive Third-Party API |
Distributed trace shows high latency for external API call |
Implement caching, retries with backoff, circuit breakers, asynchronous calls, fallbacks |
Conclusion
Upstream request timeouts are an inescapable reality in the world of distributed systems. Far from being mere error messages, they are critical signals indicating a breakdown in the delicate balance of performance, capacity, and communication within an application's architecture. From the client's initial request to the final processing by an upstream API service, and through the intelligent routing performed by the API gateway, every layer plays a pivotal role in ensuring a responsive user experience. Neglecting these timeout errors not only frustrates users but can also lead to cascading failures, resource exhaustion, and significant operational overhead.
Our exploration has traversed the entire lifecycle of an API request, dissecting the precise meaning of an upstream timeout, unraveling the complexities of its underlying architecture, and meticulously cataloging its common causes—ranging from overworked backend services and inefficient code to subtle network glitches and misconfigured timeouts. We've armed ourselves with a comprehensive arsenal of diagnostic tools, emphasizing the power of proactive monitoring, granular logging, and sophisticated tracing to pinpoint the exact origin of delays.
Crucially, we've outlined a robust framework for remediation, advocating for a multi-faceted approach that integrates:
- Deep-seated performance optimizations within upstream services, focusing on efficient code, optimized database interactions, and judicious resource management.
- Thoughtful and precise configuration of timeouts at every level, particularly within the API gateway, to strike a balance between responsiveness and resilience.
- The strategic implementation of resilience patterns like retries, circuit breakers, and bulkheads, which fortify systems against the inevitable turbulence of production environments.
- Continuous attention to network infrastructure to eliminate hidden bottlenecks and ensure seamless data flow.
- Pragmatic strategies for managing external dependencies, which often lie beyond our direct control.
Beyond reactive fixes, the ultimate goal is prevention. By embracing best practices such as designing for failure, rigorously performance testing, maintaining vigilant monitoring and alerting systems, and fostering a culture of continuous improvement through SRE principles, organizations can build API-driven applications that are not just performant, but inherently reliable. The journey to understanding and fixing upstream request timeouts is a continuous one, demanding a blend of technical expertise, systematic thinking, and a commitment to operational excellence. By mastering this domain, we can ensure that our systems remain robust, responsive, and ready to deliver seamless experiences, even in the face of unforeseen challenges.
FAQ
1. What is the difference between a 504 Gateway Timeout and a 502 Bad Gateway error? A 504 Gateway Timeout indicates that the API gateway (or another intermediary server) did not receive a timely response from the upstream server it was trying to access to complete the request. It literally "timed out." A 502 Bad Gateway error, on the other hand, means the API gateway received an invalid response from the upstream server. This often implies the upstream server was accessible but returned something unexpected or malformed, or perhaps it crashed or was unavailable in a way that prevented a proper HTTP response.
2. How do API gateways contribute to or help prevent upstream timeouts? API gateways are central to this issue because they are the point where timeouts are typically enforced between the gateway and upstream services. If configured improperly, a gateway can prematurely time out legitimate requests. However, gateways also prevent timeouts by acting as load balancers, distributing traffic to healthy upstream instances, and can implement circuit breakers to prevent clients from overwhelming struggling services. Solutions like APIPark provide sophisticated traffic management and monitoring, offering granular control over these configurations to mitigate timeouts proactively.
3. Is increasing the timeout value always the best solution for upstream request timeouts? No, simply increasing the timeout value is often a temporary band-aid and rarely the best long-term solution. While it might alleviate immediate errors, it can mask underlying performance issues in the upstream service, leading to increased resource consumption (connections tied up, memory usage) and potentially cascading failures if the slow service eventually impacts others. The best approach is to identify and fix the root cause of the delay, such as code inefficiencies, database bottlenecks, or resource contention, before adjusting timeouts as a last resort or only for genuinely long-running, legitimate operations.
4. How can I effectively monitor for upstream request timeouts in a microservices environment? Effective monitoring involves a multi-pronged approach: * Centralized Logging: Aggregate logs from your API gateway and all upstream services, using correlation IDs to trace requests. * Metrics Collection: Monitor 504/502 error rates, latency, and resource utilization (CPU, memory, network, database connections) across all services using tools like Prometheus, Grafana, Datadog, or cloud-native solutions. * Distributed Tracing: Implement distributed tracing (e.g., Jaeger, OpenTelemetry) to visualize the entire request flow across multiple services and identify where time is being spent. * Alerting: Set up alerts for deviations from normal behavior or threshold breaches (e.g., high error rates, prolonged high latency) to notify teams immediately.
5. What are some common resiliency patterns that help with upstream timeouts? Several patterns enhance system resilience against timeouts: * Retries with Exponential Backoff: Automatically re-attempt failed requests after increasing intervals, primarily for transient errors. * Circuit Breakers: Prevent repeated calls to a failing service, allowing it to recover and protecting calling services from cascading failures. * Bulkheads: Isolate resources (e.g., thread pools) for different service dependencies, ensuring that a failure in one doesn't exhaust resources needed by others. * Timeouts and Deadlines: Explicitly define how long an operation should take at each service boundary, with the option to propagate a global deadline.
🚀You can securely and efficiently call the OpenAI API on APIPark in just two steps:
Step 1: Deploy the APIPark AI gateway in 5 minutes.
APIPark is developed based on Golang, offering strong product performance and low development and maintenance costs. You can deploy APIPark with a single command line.
curl -sSO https://download.apipark.com/install/quick-start.sh; bash quick-start.sh

In my experience, you can see the successful deployment interface within 5 to 10 minutes. Then, you can log in to APIPark using your account.

Step 2: Call the OpenAI API.