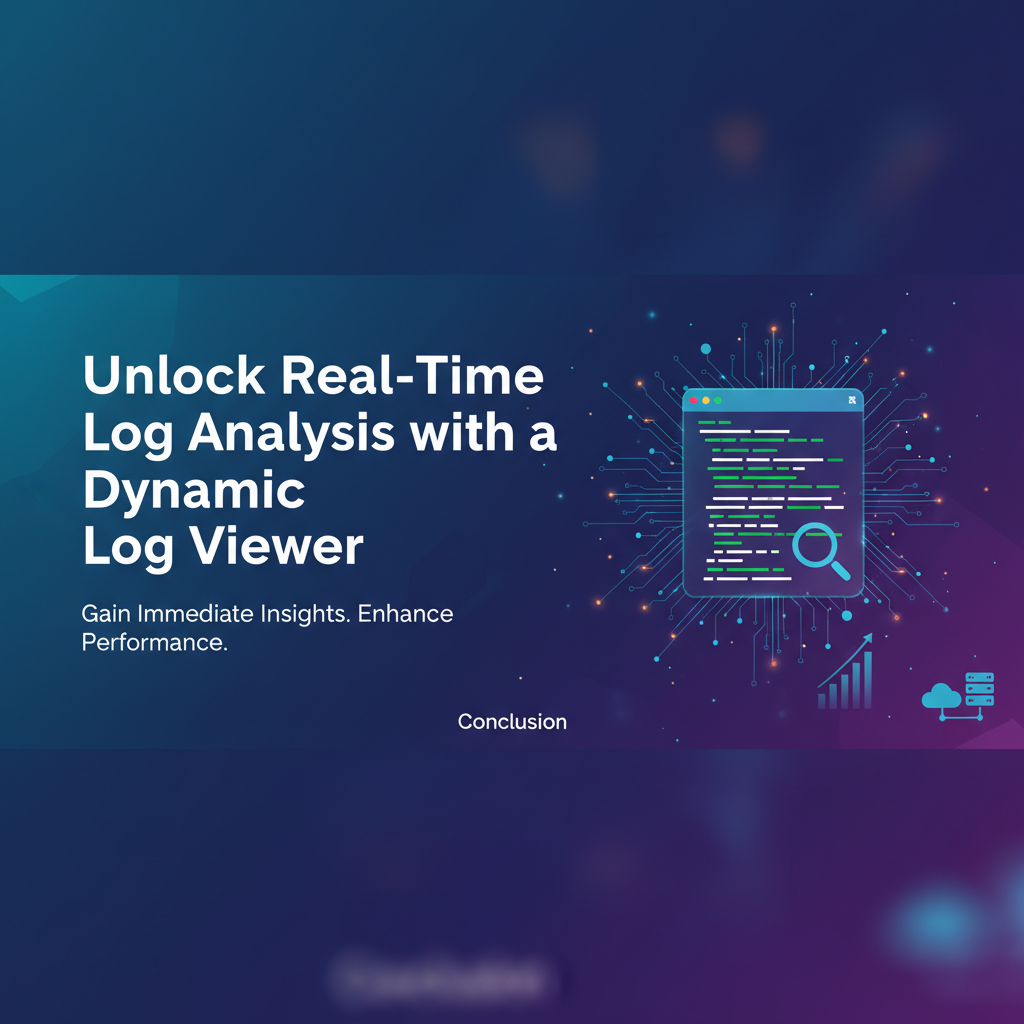
Unlock Real-Time Log Analysis with a Dynamic Log Viewer


In the relentless hum of modern digital infrastructure, from cloud-native microservices to on-premise behemoths, an unseen yet utterly critical stream of information pulses through every component: logs. These seemingly mundane textual records, generated by applications, servers, databases, and network devices, hold the secrets to system health, performance bottlenecks, security breaches, and user behavior. However, the sheer volume, velocity, and variety of these logs have escalated to unprecedented levels, rendering traditional, static analysis methods obsolete. The challenge is no longer merely collecting logs, but transforming this chaotic deluge into actionable intelligence, in real time. This is precisely where the power of a dynamic log viewer comes, not just as a tool, but as a strategic imperative, allowing organizations to unlock profound insights, preempt failures, and bolster their security posture with unparalleled agility.
Imagine an orchestra playing a complex symphony. Every instrument, every musician, contributes to the overall sound, but also generates its own unique 'noise' or 'feedback'. To understand the harmony, or to diagnose a sour note, one cannot simply listen to isolated sounds; one needs a conductor, an auditor, who can perceive the entire soundscape, isolate issues, and understand their impact on the whole. In the world of IT, logs are those individual sounds, and a dynamic log viewer is the astute conductor, providing the real-time perspective needed to orchestrate system reliability and performance. This comprehensive guide will delve deep into the transformative capabilities of dynamic log viewers, exploring their architecture, functionalities, use cases, and how they become an indispensable asset in the complex dance of digital operations.
The Log Tsunami: Why Traditional Methods Fail in a Data-Rich World
The digital ecosystem of today is characterized by an exponential increase in complexity and scale. Monolithic applications have given way to distributed microservices architectures, containerization, serverless functions, and multi-cloud deployments. Each of these components, constantly interacting and evolving, generates a voluminous stream of logs. This "log tsunami" presents formidable challenges that overwhelm conventional log analysis approaches, making them insufficient for the demands of modern operations.
The Four Vs of Log Challenges: Volume, Velocity, Variety, and Veracity
- Volume: The sheer quantity of logs generated daily is staggering. A medium-sized enterprise might generate terabytes, even petabytes, of log data from thousands of servers, applications, and network devices. Storing this data alone becomes a significant operational and financial burden. Furthermore, sifting through millions or billions of log entries manually is simply impossible, akin to finding a needle in a haystack – or rather, a specific strand of hay in a field of haystacks. Without intelligent indexing and rapid search capabilities, this data remains largely inaccessible for practical analysis. This immense volume necessitates highly scalable storage solutions and efficient processing pipelines that can ingest, index, and query vast datasets without significant latency.
- Velocity: Logs are not generated in slow, predictable trickles; they pour in at an incredible speed. In high-traffic environments, thousands, even tens of thousands, of log events can occur per second. This rapid influx demands real-time processing capabilities. Traditional batch processing methods, where logs are collected over a period and then analyzed, introduce unacceptable delays. By the time a critical issue is identified through batch analysis, it might have already caused significant downtime, data corruption, or security breaches, leading to severe financial and reputational damage. The ability to "live-tail" logs and react to events as they happen is paramount for proactive incident response and performance optimization.
- Variety: Log data comes in a myriad of formats and structures. There are structured logs (e.g., JSON, key-value pairs), semi-structured logs (e.g., Apache access logs, syslog), and completely unstructured logs (e.g., raw text messages from custom applications). Each application, operating system, and hardware device may have its own logging convention, using different timestamps, field names, and message formats. This heterogeneity makes standardized parsing and analysis a daunting task. Without a robust mechanism to normalize, parse, and enrich these diverse log types, correlation across different systems becomes exceedingly difficult, hindering a holistic understanding of system behavior. A truly dynamic log viewer must be able to ingest and make sense of this kaleidoscopic data landscape.
- Veracity: The accuracy and trustworthiness of log data are crucial. Logs can sometimes be incomplete, malformed, or even misleading due to misconfigurations, software bugs, or malicious tampering. Relying on inaccurate logs can lead to false positives, misdiagnoses, and wasted effort in troubleshooting. Ensuring the integrity and reliability of log data, perhaps through checksums or secure logging practices, is an often-overlooked but essential aspect of effective log management. A sophisticated log analysis platform should also be able to highlight anomalies that might indicate data veracity issues, preventing operators from chasing phantom problems.
Beyond the Four Vs: The Human Element and Integration Complexity
Beyond the technical challenges of volume, velocity, variety, and veracity, traditional log analysis tools often fall short due to their lack of user-friendliness and integration capabilities. Manual log inspection, typically involving SSH into servers and using command-line tools like grep, awk, and tail, is not only slow and error-prone but also requires specialized skills and provides no centralized view or historical context. Different teams often use different tools, leading to fragmented insights and communication silos.
Furthermore, integrating disparate log sources from diverse environments – on-premises data centers, multiple cloud providers, and various software components – requires significant engineering effort. Without a unified platform that can ingest, process, and present logs from all these sources, operations teams are left piecing together fragmented narratives, making root cause analysis a prolonged and frustrating endeavor. The modern IT landscape demands a more intelligent, integrated, and intuitive approach to log analysis, paving the way for the indispensable role of a dynamic log viewer.
Understanding Real-Time Log Analysis: The Pulse of Proactive Operations
Real-time log analysis transcends the reactive troubleshooting of yesteryear, offering a continuous, immediate understanding of system behavior. It's the ability to process, analyze, and visualize log data as it's generated, allowing for instantaneous insights and proactive intervention. This paradigm shift from forensic post-mortem to live monitoring fundamentally alters how organizations manage their digital infrastructure.
Defining Real-Time Log Analysis
At its core, real-time log analysis involves:
- Instantaneous Ingestion: Logs are collected and streamed into a centralized system as soon as they are generated, minimizing any delay between an event occurring and its logging.
- On-the-Fly Processing: The ingested logs are immediately parsed, indexed, and enriched. This might involve extracting key fields, adding contextual metadata (e.g., geographic location, user identity, service name), and normalizing data formats.
- Dynamic Visualization: The processed data is then presented through interactive dashboards and viewers that update continuously, reflecting the most current state of the system.
- Automated Alerting: Predefined rules or anomaly detection algorithms continuously scan the incoming log streams for critical patterns, anomalies, or threshold breaches, triggering automated alerts to relevant teams.
The Transformative Benefits of Real-Time Insights
Embracing real-time log analysis with a dynamic log viewer yields a multitude of profound benefits that drive operational excellence and business resilience:
- Immediate Issue Detection and Resolution: This is perhaps the most direct and impactful benefit. Instead of discovering a system outage or performance degradation hours after it has occurred, real-time analysis allows operations teams to detect issues within seconds or minutes. This rapid detection drastically reduces Mean Time To Detect (MTTD) and, consequently, Mean Time To Resolution (MTTR), minimizing downtime and its associated costs. For example, a sudden spike in error logs from a critical microservice can trigger an alert, allowing engineers to investigate and mitigate the problem before it impacts end-users.
- Proactive Performance Monitoring and Optimization: Beyond just detecting failures, real-time log analysis provides continuous visibility into application and infrastructure performance. By monitoring key metrics extracted from logs – such as response times, transaction rates, resource utilization, and latency – teams can identify subtle performance degradations, anticipate bottlenecks, and optimize resource allocation before they escalate into critical problems. This allows for fine-tuning configurations, scaling resources dynamically, and improving overall system efficiency.
- Enhanced Security Posture and Incident Response: Security events often manifest as specific patterns in log data – multiple failed login attempts, unusual access patterns, unauthorized command executions, or data exfiltration attempts. Real-time analysis enables security teams to detect these malicious activities as they unfold, facilitating immediate containment and response. It transforms security from a reactive audit function into a proactive threat hunting and incident response capability, crucial for combating sophisticated cyber threats. For instance, logs from a network gateway showing an unusual volume of data egress could signal a breach, prompting immediate investigation.
- Robust Compliance and Auditing: Many regulatory frameworks (e.g., GDPR, HIPAA, PCI DSS) mandate detailed logging and auditing of system activities. Real-time log analysis provides an immutable, easily auditable trail of events, proving compliance with these stringent requirements. It simplifies the process of generating audit reports and demonstrates due diligence in data protection and system integrity, which can be critical during regulatory reviews.
- Deeper Business Intelligence and User Behavior Analysis: Logs are not just for technical operations; they also contain a wealth of information about user interactions, feature adoption, and application usage patterns. By analyzing logs in real time, product managers and business analysts can gain immediate insights into user behavior, identify popular features, detect friction points in user journeys, and track the impact of new deployments. This data-driven approach fosters continuous product improvement and a better understanding of customer needs. For example, a sudden drop in logs indicating successful checkouts might signal a problem with the payment API.
- Improved Collaboration and Communication: A centralized, real-time log analysis platform provides a single source of truth for all operational data. This fosters better collaboration between development, operations, and security teams. Everyone can view the same live data, share insights, and coordinate troubleshooting efforts more effectively, breaking down silos and accelerating problem resolution. This shared understanding is vital in complex, distributed environments where different teams manage different components.
In essence, real-time log analysis is not merely about collecting data; it's about harnessing the full predictive and diagnostic power of that data to create more resilient, performant, and secure digital systems. It moves organizations from a state of being reactive to being proactively in control, turning the log tsunami into a navigable sea of actionable intelligence.
The Power of a Dynamic Log Viewer: Your Command Center for Logs
A dynamic log viewer is more than just an interface; it's the command center for navigating the vast and complex landscape of log data. Unlike static log file readers, a dynamic viewer provides interactive, real-time capabilities that empower users to explore, filter, correlate, and visualize logs with unparalleled flexibility and speed. It transforms raw, chaotic data into a structured, understandable narrative.
Core Functionalities: The Bedrock of Effective Analysis
The foundation of any powerful dynamic log viewer rests on a set of essential functionalities that enable users to interact with their data effectively:
- Powerful Search and Filtering:
- Full-Text Search: The ability to rapidly search across all log fields for any keyword or phrase is fundamental. This needs to be highly optimized for performance, even across petabytes of data, often relying on inverted indices.
- Field-Specific Search: Users must be able to narrow down searches to specific log fields (e.g.,
status_code:500,user_id:123,service_name:auth-service). This requires logs to be parsed and indexed with identifiable fields. - Regex Support: For complex pattern matching and extracting specific information from unstructured log messages, regular expressions are indispensable. A dynamic viewer should allow users to apply regex during searches and even during parsing.
- Boolean Logic and Wildcards: Combining search terms with AND, OR, NOT operators, and using wildcards (
*) to match partial strings, significantly enhances search precision and flexibility, allowing for highly targeted investigations. - Time-Range Filtering: Crucially, users need to define specific time windows for their searches, from the last 5 minutes to the last 90 days, enabling focused analysis on periods of interest, such as during an incident or after a deployment.
- Aggregation and Correlation:
- Count and Group By: Aggregating log entries by common fields (e.g., counting errors by
service_name, grouping uniqueuser_ids bycountry) provides immediate high-level insights into trends and distributions. This helps identify the most problematic services or regions at a glance. - Statistical Functions: Calculating averages, sums, minimums, maximums, and percentiles for numeric fields within logs (e.g., average
response_timefor a particular API) helps in performance analysis and capacity planning. - Log Correlation Across Systems: The ability to link related log entries from different systems or components (e.g., matching a request ID from a web server log to an application server log and then to a database log) is vital for tracing transactions end-to-end in distributed architectures. This often relies on consistent trace IDs or correlation IDs generated at the gateway or application entry point.
- Count and Group By: Aggregating log entries by common fields (e.g., counting errors by
- Visualization and Dashboards:
- Charts and Graphs: Transforming numerical and categorical log data into intuitive visual formats – line charts for trends over time, bar charts for counts, pie charts for distributions – makes complex data easily digestible.
- Customizable Dashboards: Users should be able to create personalized dashboards tailored to their specific roles or monitoring needs, combining various visualizations, search queries, and real-time feeds into a single pane of glass. This allows different teams (DevOps, Security, Business) to focus on the metrics and events most relevant to them.
- Geospatial Visualization: For logs containing location data (IP addresses, GPS coordinates), plotting events on a map can reveal geographical patterns, identify potential attacks from specific regions, or analyze regional service performance.
Dynamic Capabilities: Bringing Logs to Life
What truly elevates a log viewer from merely functional to dynamically powerful are its real-time and interactive features:
- Live Tailing: This feature allows users to view incoming log events as they happen, in real time, much like the
tail -fcommand in Linux but often with enhanced parsing and filtering. It's invaluable for debugging live systems, observing the immediate impact of deployments, or monitoring critical transactions as they occur. The ability to pause, scroll back, and apply filters to the live stream adds immense flexibility. - Interactive Dashboards and Drill-Downs: Dynamic dashboards are not static images; they respond to user input. Clicking on a segment of a pie chart (e.g., all 500 errors) should automatically update other visualizations and filter the underlying log data to show only the relevant entries. This intuitive drill-down capability allows users to start from a high-level overview and progressively zoom into specific details to pinpoint root causes.
- Anomaly Detection: Leveraging machine learning algorithms, dynamic log viewers can automatically identify deviations from normal patterns in log data. This could be an unexpected spike in error rates, an unusual number of logins from a new IP address, or a sudden change in application behavior. Anomaly detection shifts the burden from manually defining thresholds to intelligently recognizing significant changes, often flagging issues that human observers might miss.
- Pattern Recognition and Clustering: Logs often contain recurring patterns, especially error messages or warnings. Dynamic viewers can employ algorithms to group similar log messages, even if they have slight variations, into clusters. This helps in identifying prevalent issues, reducing noise, and simplifying the analysis of repetitive events. For instance, multiple unique error messages stemming from the same underlying code bug can be grouped, revealing the systemic nature of the problem.
- Contextual Enrichment: A dynamic viewer can go beyond simply displaying logs. It can enrich log entries with external data sources in real-time. This might include correlating IP addresses with geographical data, linking user IDs to internal user management systems, or pulling in deployment metadata to associate logs with specific code versions. This added context dramatically speeds up troubleshooting by providing a holistic picture without needing to cross-reference multiple systems manually.
- Customizable Views and Alerts: The ability for users to define and save their specific searches, filters, and dashboard layouts is crucial for personalization. Furthermore, users can set up sophisticated alert rules based on specific log patterns, aggregated metrics, or detected anomalies, ensuring that critical events trigger immediate notifications through various channels (email, Slack, PagerDuty).
In essence, a dynamic log viewer is the ultimate tool for empowering operations teams, developers, and security analysts to take control of their log data. It transforms an overwhelming torrent of information into a manageable, interactive, and intelligent stream of insights, making the process of monitoring, debugging, and securing complex systems far more efficient and effective.
Key Components of a Robust Log Analysis Ecosystem
A dynamic log viewer doesn't operate in isolation; it's the tip of the iceberg in a sophisticated log analysis ecosystem. This ecosystem comprises several interconnected components, each playing a critical role in the end-to-end process of collecting, processing, storing, and presenting log data. Understanding these components is essential for building a scalable, reliable, and effective log management solution.
1. Log Collection: The Ingestion Pipeline
The first step in any log analysis strategy is efficiently collecting logs from diverse sources. This involves various mechanisms, each suited for different environments:
- Agents/Forwarders: Lightweight software agents installed on individual servers or containers (e.g., Filebeat, Fluentd, Logstash-forwarder) are the most common method. They monitor specified log files, tails new entries, and forward them to a central log management system. They can also apply basic filtering or parsing at the source.
- API/SDK Integration: Applications can send logs directly to a centralized collector via a logging API or SDK (e.g., using a structured logging library like Log4j or Serilog). This allows for highly structured logs and more control over log content.
- Syslog: A traditional standard for message logging, particularly prevalent in Unix-like operating systems and network devices. Syslog daemons collect system events and can forward them to a remote syslog server.
- Cloud Integrations: Cloud providers (AWS CloudWatch, Azure Monitor, Google Cloud Logging) offer native services to collect logs from various cloud resources. These services can often be integrated with external log analysis platforms.
- Network Taps/Flow Data: For network-level insights, tools can capture network traffic (packet data) or flow records (NetFlow, IPFIX) and convert them into log-like events for security monitoring and traffic analysis.
2. Log Storage: Scalability and Durability
Once collected, logs need to be stored in a scalable, durable, and cost-effective manner that facilitates rapid querying. The choice of storage depends on retention requirements, query performance needs, and budget:
- Distributed Document Stores (e.g., Elasticsearch, OpenSearch): These are popular choices due to their ability to store massive volumes of semi-structured log data, provide full-text search capabilities, and scale horizontally. They are often combined with data streams for efficient time-series data management.
- Object Storage (e.g., AWS S3, Azure Blob Storage, Google Cloud Storage): Highly cost-effective for long-term archival of raw log data. While not directly queryable in real-time, it serves as a robust cold storage tier, often used in conjunction with data lakes and analytical tools for periodic or deep historical analysis.
- Relational Databases (e.g., PostgreSQL, MySQL): Less common for raw, high-volume log storage due to schema rigidity and performance limitations for full-text search, but suitable for storing aggregated log metrics or highly structured critical events.
- Data Warehouses (e.g., Snowflake, Google BigQuery): Excellent for analytical queries over structured log data, particularly for business intelligence and long-term trend analysis, though often more expensive for raw log ingestion.
3. Log Processing: Transforming Raw Data into Insight
Raw log data is often messy and inconsistent. The processing layer transforms this raw data into a clean, structured, and enriched format suitable for analysis:
- Parsing: Extracting meaningful fields from log messages. This involves using regular expressions, grok patterns, or JSON parsers to turn unstructured text into structured key-value pairs (e.g., extracting
timestamp,log_level,message,service_name,request_id). - Filtering: Dropping irrelevant log entries (e.g., verbose debug messages during normal operations) to reduce storage costs and noise.
- Enrichment: Adding contextual metadata to log entries. This could include:
- Geographical Data: Mapping IP addresses to location.
- User Information: Linking user IDs to names or roles from an identity provider.
- Deployment Information: Adding details about the application version, host, or container ID.
- Threat Intelligence: Cross-referencing IP addresses or URLs with known malicious lists.
- Normalization: Standardizing field names and values across different log sources to enable consistent querying and correlation. For instance, ensuring that "error" is always
level:errorregardless of the original source. - Indexing: Creating efficient data structures (like inverted indices) that enable rapid searching and querying of log data. This is a critical step for real-time performance in tools like Elasticsearch.
4. Log Visualization: The Dynamic Log Viewer
This is where the processed data comes to life. The dynamic log viewer provides the interactive interface for users to explore, visualize, and interact with their logs in real-time. As discussed previously, this component features powerful search, filtering, aggregation, and customizable dashboards. It's the user's primary window into the health and activity of their systems, making complex data accessible and actionable.
5. Alerting & Notification: Proactive Issue Resolution
A robust log analysis ecosystem is incomplete without a mechanism for proactive alerting. This component continuously monitors the processed log streams for predefined conditions or anomalies and triggers notifications when these conditions are met:
- Threshold-Based Alerts: Triggered when a metric exceeds or falls below a certain threshold (e.g., more than 100 5xx errors in 5 minutes).
- Pattern-Based Alerts: Triggered by the occurrence of specific log messages or sequences of events (e.g., "authentication failed" followed by "account locked").
- Anomaly Detection Alerts: Based on machine learning models that identify statistically significant deviations from normal behavior, even without predefined thresholds.
- Integration with Notification Channels: Alerts are routed to relevant teams via email, SMS, Slack, PagerDuty, Jira, or other incident management systems, ensuring timely awareness and response.
By orchestrating these components effectively, organizations can build a resilient, scalable, and intelligent log analysis ecosystem that transforms raw data into a powerful tool for operational excellence, security, and business insight.
Integrating Log Analysis with Modern Architectures: The Role of APIs and Gateways
Modern software architectures, particularly microservices and cloud-native deployments, significantly amplify the challenges and opportunities for log analysis. These distributed systems generate an even more complex tapestry of log data, making unified logging and correlation absolutely essential. Crucially, in these architectures, APIs (Application Programming Interfaces) and API Gateways emerge as central points for both data exchange and log generation, providing invaluable insights into system behavior.
Microservices and Cloud-Native Environments: A Distributed Logging Landscape
In a microservices architecture, a single user request might traverse dozens of independent services, each running in its own container or serverless function. Each service generates its own set of logs. This distributed nature makes traditional, centralized logging challenging:
- Distributed Tracing: To understand the end-to-end flow of a request, logs from different services need to be correlated. This is often achieved through distributed tracing systems (like OpenTelemetry or Jaeger) that inject unique trace IDs into requests, allowing log entries related to the same transaction to be linked across service boundaries. A dynamic log viewer can then use these trace IDs to filter and visualize the entire transaction path.
- Contextual Logging: Each log entry needs sufficient context (service name, host, container ID, request ID, user ID) to be meaningful when viewed out of context. Structured logging is paramount here, ensuring logs are emitted in a machine-readable format like JSON.
- Ephemeral Nature: Containers and serverless functions are often short-lived and immutable. Logs must be extracted from these ephemeral environments before they disappear, necessitating robust log forwarding agents or direct streaming to a centralized system.
Cloud-native platforms further abstract the infrastructure, introducing new log sources from managed services (databases, message queues, serverless platforms) and requiring integrations with cloud-specific logging services (e.g., AWS CloudWatch Logs, Azure Monitor Logs). A comprehensive log analysis solution must be able to seamlessly ingest logs from all these diverse cloud sources.
The Pivotal Role of APIs and API Gateways in Log Generation
In any distributed system, APIs are the ligaments that connect different services, allowing them to communicate and exchange data. An API Gateway, positioned at the edge of an application or microservices cluster, acts as a single entry point for all incoming API requests. This strategic position makes API Gateways an incredibly rich source of critical log data, offering a unique vantage point into system health, performance, and security.
- Centralized Traffic Visibility: Every request entering the system, every response leaving it, every routing decision, and every authentication check passes through the API Gateway. This makes the gateway's logs an unparalleled source of information about overall system traffic patterns, client behavior, and service consumption. Logs from the gateway can reveal:
- Request Volume and Rate: How many requests are coming in, and at what frequency?
- Response Times: The latency experienced by clients at the edge.
- Error Rates: The percentage of failed requests, categorized by status code (e.g., 4xx, 5xx).
- Client IP Addresses and User Agents: Information about who is calling the APIs.
- API Endpoints Accessed: Which specific API paths are most frequently used.
- Security Auditing and Threat Detection: As the first line of defense, API Gateways perform authentication, authorization, and rate limiting. Their logs contain critical security events:
- Failed Authentication Attempts: Indicating potential brute-force attacks.
- Unauthorized Access Attempts: Requests trying to access resources without proper permissions.
- Rate Limit Breaches: Signifying potential denial-of-service (DoS) attacks or misbehaving clients.
- Policy Violations: Attempts to bypass security policies enforced at the gateway. Analyzing these logs in real time is crucial for detecting and responding to security incidents promptly.
- Performance Monitoring of the API Layer: The API Gateway provides a high-level view of API performance. Spikes in latency or error rates observed at the gateway level can signal issues within downstream services, even before those services' own logs fully reveal the problem. By monitoring API-specific metrics from gateway logs, operations teams can quickly identify broad performance degradations and pinpoint which APIs are affected.
- APIPark: Enhancing API-Specific Log Analysis: This is where specialized platforms like APIPark become invaluable. As an open-source AI gateway and API management platform, APIPark offers robust capabilities for managing and securing APIs, including exceptionally detailed API call logging.The granular logs generated by APIPark capture every nuance of API interactions – from the initial request headers and body to the final response status and latency. This rich dataset, when integrated with a dynamic log viewer, empowers businesses to: * Rapidly Trace API-Specific Issues: Pinpoint the exact API call that failed, understand the request parameters, and see the corresponding error response, significantly accelerating debugging within the API ecosystem. * Monitor API Performance with Precision: Analyze performance metrics for individual APIs, track latency distributions, and identify slow API endpoints or bottlenecks. * Enhance API Security: Review all API access attempts, identify suspicious patterns, and audit authentication/authorization outcomes for compliance. * Gain Deeper Business Insights: Understand which APIs are most consumed, identify peak usage times, and track API adoption rates, providing valuable data for product development and capacity planning.The detailed API call logging feature of APIPark acts as a crucial data source, transforming generic log analysis into highly targeted and effective API governance, ensuring system stability and data security specifically within the API landscape.
By integrating logs from API Gateways and specialized platforms like APIPark with logs from applications and infrastructure components into a dynamic log viewer, organizations gain a holistic, real-time understanding of their entire system. This unified perspective is paramount for maintaining the performance, security, and reliability of modern, distributed architectures. The gateway logs act as a critical control point, offering insights that are difficult to gather from individual service logs alone.
APIPark is a high-performance AI gateway that allows you to securely access the most comprehensive LLM APIs globally on the APIPark platform, including OpenAI, Anthropic, Mistral, Llama2, Google Gemini, and more.Try APIPark now! 👇👇👇
Use Cases for Real-Time Log Analysis: Driving Operational Excellence
The practical applications of real-time log analysis with a dynamic log viewer are vast and touch every aspect of IT operations, security, and even business intelligence. It's a versatile tool that helps various stakeholders make data-driven decisions swiftly and effectively.
1. Troubleshooting and Debugging in Live Environments
This is arguably the most common and immediate use case. When an application misbehaves, or a service goes down, engineers need to quickly understand what went wrong.
- Rapid Root Cause Analysis: Instead of sifting through fragmented log files on different servers, a dynamic log viewer allows engineers to immediately search across all relevant logs for error messages, exceptions, or specific transaction IDs within a defined time window. By filtering for critical severity levels (ERROR, FATAL) and correlating logs from dependent services, they can pinpoint the exact component or line of code causing the issue in minutes, dramatically reducing Mean Time To Resolution (MTTR).
- Live Debugging of Deployments: After a new deployment, engineers can use live tailing to monitor logs for any unexpected errors, warnings, or performance regressions. This proactive monitoring enables them to roll back problematic deployments before they impact a significant number of users, ensuring continuous delivery practices are safer and more reliable.
- Identifying Intermittent Issues: Some problems are not constant but appear sporadically. A dynamic viewer can help uncover these "flapping" issues by identifying patterns in logs that indicate intermittent failures, such as repeated connection timeouts or database contention that occurs only during peak load.
2. Performance Monitoring and Optimization
Logs contain a treasure trove of performance-related metrics that, when analyzed in real time, can provide deep insights into system health and potential bottlenecks.
- Latency Monitoring: Extracting response times from application or API gateway logs allows for real-time tracking of latency. A sudden increase in average response time for a critical API can trigger an alert, prompting investigation into underlying service performance.
- Resource Utilization: Logs can record CPU, memory, and disk usage for individual components. Analyzing these logs helps identify resource hogs, potential memory leaks, or services that are under-provisioned, enabling proactive scaling or optimization.
- Throughput and Concurrency: Monitoring the number of requests processed per second, or the number of active users, derived from logs, helps in understanding system load and ensuring that the infrastructure can handle current and projected traffic. Visualizing these trends in a dynamic dashboard allows for quick assessment of capacity.
- SQL Query Performance: Database access logs can reveal slow-running queries or frequently executed queries, guiding database administrators in optimizing their schemas or query patterns to improve overall application performance.
3. Security Incident Response and Threat Detection
Logs are the digital breadcrumbs of every action taken within a system, making them indispensable for security.
- Real-time Threat Detection: Security teams can configure alerts for suspicious activities such as multiple failed login attempts, access from unusual geographical locations, attempts to escalate privileges, or execution of unauthorized commands. The dynamic nature allows for immediate detection and investigation of potential breaches, enabling rapid containment.
- Forensic Analysis: After a security incident has occurred, logs provide the comprehensive historical record needed for forensic analysis. Investigators can use the dynamic log viewer to meticulously reconstruct the sequence of events, identify the entry point of an attack, determine the extent of compromise, and understand the attacker's actions, which is crucial for post-incident remediation and preventing future attacks.
- Compliance Auditing: Many regulatory frameworks (e.g., PCI DSS, GDPR, HIPAA, SOC 2) require detailed audit trails of system access and data manipulation. Logs provide undeniable proof of compliance. A dynamic log viewer simplifies the generation of audit reports, demonstrating who did what, when, and where, crucial for passing regulatory inspections.
- Malware and Vulnerability Detection: Unusual process creations, modifications to system files, or outbound connections to known malicious IP addresses (when cross-referenced with threat intelligence feeds) can be detected through real-time log analysis, helping to identify malware infections or exploitation attempts.
4. Business Intelligence and User Behavior Analysis
Beyond technical operations, logs also contain valuable insights for product and business teams.
- User Journey Mapping: By correlating user IDs across different application logs, businesses can reconstruct user journeys, understand how users interact with their application, identify common navigation paths, and pinpoint areas where users drop off or experience friction.
- Feature Adoption and Usage: Logs can track which features are being used, how frequently, and by whom. This data is invaluable for product managers to assess the success of new features, prioritize development efforts, and make data-driven decisions about product roadmaps.
- A/B Testing Analysis: For A/B testing, logs can capture which version of a feature a user was exposed to and their subsequent interactions. This allows for real-time analysis of the impact of different feature variations on user engagement and conversion rates.
- Marketing Campaign Effectiveness: By tracking specific events in logs associated with marketing campaigns (e.g., sign-ups from a particular referral source), businesses can measure the effectiveness of their marketing spend and optimize future campaigns.
5. Capacity Planning and Resource Management
Analyzing historical log data for usage patterns, peak loads, and growth trends is crucial for effective capacity planning.
- Predictive Scaling: By observing historical patterns of resource consumption and request volumes recorded in logs, organizations can predict future demands and proactively scale their infrastructure, avoiding performance degradation during peak times.
- Cost Optimization: Identifying services that are consistently over-provisioned or under-utilized based on their log-derived resource metrics allows for optimization of cloud spending and better resource allocation.
The breadth of these use cases underscores the indispensable nature of real-time log analysis with a dynamic log viewer. It's not just a tool for IT professionals; it's a strategic asset that empowers an entire organization to operate more efficiently, securely, and intelligently.
Choosing the Right Dynamic Log Viewer: A Strategic Decision
Selecting the appropriate dynamic log viewer is a critical decision that impacts an organization's operational efficiency, security posture, and financial bottom line. The market offers a diverse range of solutions, from open-source projects to commercial enterprise platforms, each with its strengths and weaknesses. The "best" choice is always the one that aligns most closely with an organization's specific needs, scale, budget, and existing technology stack.
Here are key criteria to consider when evaluating and choosing a dynamic log viewer:
1. Scalability and Performance
- Ingestion Rate: Can the viewer (and its underlying log management system) handle the volume and velocity of your log data, especially during peak times? It should be able to ingest thousands, or even tens of thousands, of events per second without dropping data or introducing significant latency.
- Storage Capacity: How much log data can it store, and for how long? Consider your retention policies and future growth projections. The solution should offer cost-effective storage tiers for both hot (frequently accessed) and cold (archival) data.
- Query Speed: How quickly can the system return search results and generate visualizations, even when querying large datasets? Real-time analysis demands near-instantaneous query performance.
- Horizontal Scalability: Can the system easily scale out by adding more nodes or resources as your log volume grows, without requiring significant architectural changes or downtime?
2. Integration Capabilities
- Log Source Support: Does it seamlessly integrate with all your existing log sources (applications, servers, databases, network devices, cloud services, containers, API Gateways)? Look for a wide array of connectors, agents, and APIs for log ingestion.
- Data Enrichment: Can it integrate with external data sources (e.g., identity management systems, threat intelligence feeds, CMDBs) to enrich log data with valuable context?
- Alerting Integrations: Does it integrate with your existing incident management, notification, and collaboration tools (e.g., PagerDuty, Slack, Jira, Opsgenie, webhooks)?
- Existing Toolchain: How well does it fit into your current DevOps, SRE, and security toolchain? Can it export data to other analytical platforms if needed?
3. Core Features and Usability
- Parsing and Normalization: How robust are its parsing capabilities for diverse log formats (structured, semi-structured, unstructured)? Can it easily normalize data across different sources?
- Search Language and Flexibility: Is the search language intuitive yet powerful, supporting full-text, field-specific, regex, and boolean searches?
- Visualization and Dashboarding: Does it offer a rich library of visualization types, customizable dashboards, and interactive drill-down capabilities?
- Anomaly Detection & AI/ML Capabilities: Does it include built-in features for automated anomaly detection, pattern recognition, or log clustering to reduce noise and highlight critical events? This is becoming increasingly important for proactive insights.
- Alerting Rules: How flexible and sophisticated are the alerting rule configurations? Can you define complex conditions based on aggregated metrics, specific log patterns, or anomalies?
- User Interface (UI) and User Experience (UX): Is the interface intuitive, easy to navigate, and efficient for both novice and expert users? A well-designed UI significantly reduces the learning curve and improves productivity.
- Multi-tenancy and Access Control: For larger organizations, can it support multiple teams or departments with segregated views and role-based access control (RBAC) over logs and dashboards?
4. Cost and Licensing Model
- Total Cost of Ownership (TCO): Beyond licensing fees, consider the costs of infrastructure (servers, storage, networking), operational overhead (maintenance, updates, staffing), and potential hidden costs (data egress fees in the cloud).
- Pricing Model: Understand the pricing structure – is it based on data ingestion volume (GB/day), storage volume, number of users, number of hosts, or a combination? How does it scale with your anticipated growth?
- Open Source vs. Commercial: Open-source solutions (like the ELK Stack – Elasticsearch, Logstash, Kibana, or Grafana Loki) offer flexibility and lower initial licensing costs but require significant internal expertise for deployment, maintenance, and scaling. Commercial solutions (like Splunk, Datadog, Sumo Logic) often provide more out-of-the-box features, better support, and managed services but come with higher recurring costs.
5. Vendor Support and Community
- Documentation and Training: Is there comprehensive documentation, tutorials, and training resources available?
- Community Support: For open-source tools, a vibrant and active community is crucial for finding solutions, sharing best practices, and getting peer support.
- Vendor Support: For commercial products, evaluate the quality, responsiveness, and service level agreements (SLAs) of the vendor's technical support.
- Roadmap and Innovation: Does the solution have an active development roadmap, with continuous innovation and new features being added to keep pace with evolving industry demands?
Table: Comparison of Log Viewer Deployment Models
| Feature Category | Open-Source (Self-Managed) e.g., ELK Stack, Grafana Loki | Commercial SaaS (Cloud-Managed) e.g., Datadog, Sumo Logic, Splunk Cloud | Commercial On-Premises e.g., Splunk Enterprise |
|---|---|---|---|
| Initial Setup Cost | Low (Software is free) | High (Subscription-based) | High (Licensing + Infrastructure) |
| Operational Overhead | High (Requires dedicated team for deployment, scaling, maintenance, upgrades) | Low (Vendor manages infrastructure, scaling, and maintenance) | High (Requires dedicated team for infrastructure, scaling, maintenance, upgrades) |
| Scalability | Highly scalable, but complexity increases with scale; requires expertise | Highly scalable, managed by vendor | Highly scalable, but requires expertise and significant hardware |
| Customization | Very High (Full control over code and configuration) | Moderate to High (Via APIs, plugins, configuration) | High (Extensive configuration and scripting) |
| Feature Set | Comprehensive, but may require integrating multiple tools | Generally very rich and integrated, with advanced features | Very rich and enterprise-grade |
| Support | Community-driven; commercial support available from third parties | Direct vendor support (often 24/7 with SLAs) | Direct vendor support (often 24/7 with SLAs) |
| Data Control/Security | Full control over data location and security | Relies on vendor's security and compliance | Full control over data location and security |
| Typical Use Cases | Startups, organizations with strong DevOps teams, cost-sensitive | Enterprises seeking rapid deployment, ease of use, comprehensive features | Large enterprises with strict data governance, specific compliance needs |
By carefully evaluating these factors against your organization's unique context, you can make an informed decision and choose a dynamic log viewer that becomes a powerful asset in your operational toolkit, driving efficiency, security, and insight across your entire digital landscape.
Best Practices for Effective Log Management with a Dynamic Viewer
Merely deploying a dynamic log viewer is only half the battle; to truly unlock its potential, organizations must adopt a disciplined approach to log management. Implementing best practices ensures that log data is not only collected and analyzed effectively but also remains a reliable and valuable asset over its lifecycle.
1. Standardize Log Formats and Content
- Structured Logging: Wherever possible, encourage applications to emit logs in a structured format (e.g., JSON). Structured logs are inherently easier to parse, query, and analyze, making them machine-readable and reducing the effort required for normalization. Include key fields like
timestamp,log_level,service_name,transaction_id,user_id, andmessage. - Consistent Naming Conventions: Standardize field names across different services and applications. For example, always use
source_ipinstead of sometimesclient_ipand sometimesremote_address. This uniformity simplifies querying and correlation across the entire ecosystem. - Meaningful Log Levels: Adhere to standard log levels (DEBUG, INFO, WARN, ERROR, FATAL) and use them consistently. Avoid using
INFOfor critical errors orERRORfor debug messages. This allows for quick filtering and prioritization of critical events. - Enrichment at the Source: Whenever feasible, enrich logs with contextual metadata as close to the source as possible (e.g., adding host IP, container ID, application version, environment). This reduces processing overhead downstream and provides immediate context during analysis.
2. Implement Robust Log Collection and Forwarding
- Reliable Agents: Use robust, fault-tolerant log agents or forwarders that can handle network outages, buffer logs locally, and resume forwarding without data loss.
- Centralized Ingestion: Ensure all logs are routed to a centralized ingestion point before being processed and stored. This provides a single source of truth and simplifies management.
- Secure Transport: Encrypt log data in transit to protect sensitive information from eavesdropping. Use secure protocols (e.g., TLS/SSL) when forwarding logs.
- Scalable Architecture: Design the log collection and ingestion pipeline to scale horizontally to accommodate sudden spikes in log volume without compromising performance or dropping data.
3. Define and Enforce Log Retention Policies
- Tiered Storage: Implement a tiered storage strategy:
- Hot Storage: For recent, frequently accessed logs (e.g., last 7-30 days) that require fast query performance in the dynamic viewer.
- Warm/Cold Storage: For older logs needed for compliance, historical analysis, or infrequent access. This data can be moved to more cost-effective object storage or data warehouses.
- Compliance Requirements: Understand and adhere to legal and regulatory retention periods for different types of log data (e.g., financial logs, security audit logs).
- Cost vs. Value: Balance the cost of storing logs with their potential value for troubleshooting, security, and business intelligence. Regularly review and adjust retention policies to avoid unnecessary storage costs.
- Automated Archiving and Deletion: Automate the process of moving old logs to archival storage or permanently deleting them once their retention period expires, ensuring compliance and managing storage effectively.
4. Prioritize Security and Access Control
- Role-Based Access Control (RBAC): Implement granular RBAC to control who can view which logs, create dashboards, and configure alerts. Not everyone needs access to sensitive security logs or PII.
- Data Masking/Redaction: Automatically mask or redact sensitive information (e.g., PII, credit card numbers, passwords) within logs before they are stored and displayed in the viewer, complying with privacy regulations like GDPR and CCPA.
- Audit Logging for the Log System Itself: Log all activities within the log management system itself (e.g., who accessed what logs, who changed configurations). This provides an audit trail for the security of your logging infrastructure.
- Secure Configuration: Follow security best practices for the log management platform itself, including strong authentication, encryption at rest, network segmentation, and regular security patching.
5. Leverage Automation and Machine Learning
- Automated Parsing: Automate the parsing of new log formats as much as possible using parsing rules, AI-driven pattern recognition, or template matching.
- Automated Alerting: Configure proactive alerts for critical issues, anomalies, and threshold breaches. Automate the routing of these alerts to the correct teams via incident management systems.
- Anomaly Detection: Implement machine learning-driven anomaly detection to automatically identify unusual patterns in log data that might indicate emerging issues or security threats, reducing reliance on manual threshold setting.
- Log Clustering: Use log clustering techniques to group similar log messages, reducing noise and highlighting the most prevalent issues, making it easier to spot patterns in high-volume log streams.
6. Foster a Culture of Logging and Log Review
- Developer Education: Educate developers on the importance of good logging practices, emphasizing structured logging, meaningful log messages, and consistent context. Integrate logging best practices into the software development lifecycle (SDLC).
- Regular Review: Encourage operations, security, and development teams to regularly review dashboards and log trends, not just during incidents. This builds familiarity with the data and helps in proactively identifying potential problems.
- Feedback Loop: Establish a feedback loop between log users and log producers (developers) to continuously improve log quality and ensure logs contain the information needed for effective analysis.
By meticulously applying these best practices, organizations can transform their log management from a reactive burden into a powerful, proactive engine for operational intelligence, security assurance, and business insight, maximizing the value derived from their dynamic log viewer.
The Future of Log Analysis: AI, Automation, and Predictive Insights
The landscape of log analysis is continuously evolving, driven by the ever-increasing volume and complexity of data, coupled with rapid advancements in artificial intelligence and machine learning. The future promises even more intelligent, automated, and predictive capabilities, transforming log viewers into even more sophisticated operational copilots.
1. AI/ML-Driven Insights and AIOps
- Advanced Anomaly Detection: Beyond simple statistical deviations, future log analysis systems will leverage more sophisticated AI models to detect subtle, multi-variate anomalies. These models will understand complex relationships between different log metrics and attributes, identifying patterns that are indicative of impending failures or sophisticated attacks, rather than just isolated events.
- Predictive Analytics: By analyzing historical log patterns and correlating them with system performance metrics, AI will be able to predict potential outages or performance degradations before they occur. For example, specific sequences of warning messages combined with gradual resource consumption increases could predict a service crash in the next few hours, enabling proactive intervention.
- Automated Root Cause Analysis: AI-powered log analysis will move beyond merely identifying problems to automatically suggesting potential root causes. By ingesting logs, metrics, traces, and even configuration changes, AI algorithms will correlate events, identify dependencies, and pinpoint the most likely source of an issue, significantly reducing MTTR.
- Natural Language Processing (NLP) for Unstructured Logs: While structured logging is ideal, a significant portion of logs remains unstructured text. Advanced NLP techniques will become even more adept at extracting meaningful information, identifying key entities, and categorizing unstructured log messages, making them fully searchable and analyzable without manual parsing rules.
- Log Clustering and Pattern Discovery: Machine learning will continuously learn and adapt to new log patterns, automatically grouping similar events, identifying evolving error signatures, and highlighting emerging trends without human intervention. This will help in sifting through the noise and focusing on truly novel issues.
2. Hyper-Automation and Self-Healing Systems
- Automated Remediation: Building on AI-driven root cause analysis, the next frontier is automated remediation. When an issue is identified and its root cause determined, the log analysis system will integrate with orchestration tools to trigger automated actions – like restarting a service, scaling up resources, rolling back a deployment, or blocking a suspicious IP address – effectively creating self-healing systems.
- Proactive Configuration Management: AI will analyze logs for configuration drift or misconfigurations that lead to errors, and automatically suggest or even apply corrective configuration changes, improving system stability.
- Automated Log Policy Management: AI could intelligently recommend optimal log retention policies, data masking rules, and access controls based on usage patterns, compliance requirements, and data sensitivity, streamlining log governance.
3. Observability Convergence
- Unified Observability Platforms: The clear trend is towards convergence of logs, metrics, and traces into single, unified observability platforms. Future dynamic log viewers will be seamlessly integrated within these platforms, allowing users to effortlessly pivot between different data types (e.g., from an error log entry to the corresponding trace, then to the associated performance metrics) for a holistic view. This eliminates tool sprawl and provides a comprehensive context for every incident.
- Contextual Intelligence: These platforms will leverage advanced graph databases and correlation engines to build a comprehensive map of dependencies between services, infrastructure, and user experiences. This contextual intelligence will allow the log viewer to automatically highlight how an issue in one service impacts others, providing a clearer understanding of the blast radius.
4. Enhanced User Experience and Collaboration
- Intelligent Search and Discovery: Search interfaces will become more intuitive, potentially incorporating natural language queries (e.g., "show me all critical errors from the authentication service in the last hour related to user logins"). AI will also help in suggesting relevant queries and insights.
- Personalized Dashboards and Alerts: AI will dynamically adjust dashboard layouts and alert thresholds based on individual user roles, historical behavior, and the current operational context, providing a highly personalized and relevant experience.
- Augmented Reality (AR)/Virtual Reality (VR) for Data Visualization: While speculative, immersive visualization environments could allow operations teams to explore complex, multi-dimensional log data in a more intuitive and collaborative manner, particularly for large-scale distributed systems.
The future of real-time log analysis with dynamic log viewers is one of ever-increasing intelligence and automation. These tools will evolve from sophisticated data explorers into intelligent operational partners, proactively identifying threats, predicting failures, and even initiating self-healing actions, empowering organizations to manage their increasingly complex digital environments with unprecedented efficiency and resilience. This evolution ensures that logs remain not just historical records, but powerful, forward-looking indicators of system health and security.
Conclusion: Mastering the Digital Pulse with Dynamic Log Analysis
In the high-stakes arena of modern digital operations, where every millisecond of downtime translates to lost revenue and diminished trust, the ability to understand and react to the intricate pulse of your systems is no longer a luxury—it is an absolute necessity. Logs, once relegated to obscure corners of file systems, have emerged as the single most comprehensive source of truth about the health, performance, and security of any digital infrastructure. However, the sheer volume, velocity, and variety of these logs in today's distributed, cloud-native environments have rendered traditional, static analysis methods obsolete.
This is where the transformative power of real-time log analysis, underpinned by a dynamic log viewer, fundamentally reshapes operational paradigms. By moving beyond reactive post-mortems to proactive, instantaneous insights, organizations gain an unparalleled ability to detect and resolve issues before they impact users, optimize performance with surgical precision, fortify their security posture against evolving threats, and even extract valuable business intelligence. A dynamic log viewer, with its interactive search, powerful filtering, customizable visualizations, and advanced anomaly detection capabilities, serves as the command center for this intelligence, turning a chaotic deluge of data into actionable narratives.
The strategic importance of effective log management cannot be overstated. From the crucial logs generated by an API gateway and individual API calls, providing vital insights into client interactions and service health, to the intricate event streams from microservices and cloud infrastructure, every piece of data contributes to a holistic understanding. Platforms like APIPark, which offer detailed API call logging, exemplify how specialized components contribute critical data to this broader ecosystem, empowering businesses to deeply analyze their API landscape for stability and security.
As we look to the future, the integration of AI, machine learning, and automation promises an even more intelligent era of log analysis, one where systems not only identify problems but predict them, diagnose root causes automatically, and even initiate self-healing actions. Embracing these advancements and implementing robust best practices for log standardization, collection, retention, and security will be paramount for any organization aiming to thrive in the complex digital age.
Ultimately, unlocking real-time log analysis with a dynamic log viewer is about more than just technology; it's about empowering your teams with the clarity, speed, and confidence needed to master the digital pulse of your enterprise, ensuring resilience, driving innovation, and securing your future in an increasingly interconnected world.
Frequently Asked Questions (FAQs)
1. What is a dynamic log viewer, and how does it differ from traditional log file analysis? A dynamic log viewer is an interactive tool that provides real-time access, search, filtering, and visualization of log data from various sources as it's generated. Unlike traditional methods of manually inspecting static log files (e.g., using grep or tail -f on individual servers), a dynamic viewer centralizes logs, offers powerful search across massive datasets, provides customizable dashboards, and enables live tailing, correlation, and anomaly detection across an entire infrastructure, drastically speeding up troubleshooting and insights.
2. Why is real-time log analysis crucial for modern IT operations? Real-time log analysis is crucial because modern IT environments are complex, distributed, and generate enormous volumes of data at high velocity. It enables immediate detection and resolution of issues (reducing downtime), proactive performance monitoring, real-time security incident response, and continuous compliance auditing. Without it, organizations risk prolonged outages, undetected breaches, and an inability to scale or optimize effectively.
3. How do API Gateways contribute to log analysis, and why are their logs important? API Gateways act as the central entry point for API traffic in distributed architectures. They generate critical logs about every API call, including request details, response times, error codes, client information, and authentication status. These logs are vital for understanding overall system traffic, API performance, detecting security threats (like unauthorized access or rate limit breaches), and tracing transactions from the edge to backend services. A dynamic log viewer integrates these gateway logs for a holistic view.
4. Can a dynamic log viewer help with security monitoring and compliance? Absolutely. Dynamic log viewers are indispensable for security monitoring by allowing security teams to detect suspicious patterns in real-time, such as multiple failed login attempts, unusual access from new IPs, or data exfiltration attempts. They can trigger immediate alerts for potential threats. For compliance, they provide a centralized, auditable trail of all system activities, helping organizations prove adherence to regulatory requirements like GDPR, HIPAA, and PCI DSS.
5. What are the key considerations when choosing a dynamic log viewer for my organization? When choosing a dynamic log viewer, key considerations include its scalability and performance (ingestion rate, query speed), integration capabilities with your existing log sources and tools, the richness of its core features (parsing, search, visualization, anomaly detection), its user interface and ease of use, the total cost of ownership (licensing, infrastructure, operational overhead), and the quality of vendor support or community backing. The choice should align with your organization's specific needs, budget, and technical expertise.
🚀You can securely and efficiently call the OpenAI API on APIPark in just two steps:
Step 1: Deploy the APIPark AI gateway in 5 minutes.
APIPark is developed based on Golang, offering strong product performance and low development and maintenance costs. You can deploy APIPark with a single command line.
curl -sSO https://download.apipark.com/install/quick-start.sh; bash quick-start.sh

In my experience, you can see the successful deployment interface within 5 to 10 minutes. Then, you can log in to APIPark using your account.

Step 2: Call the OpenAI API.