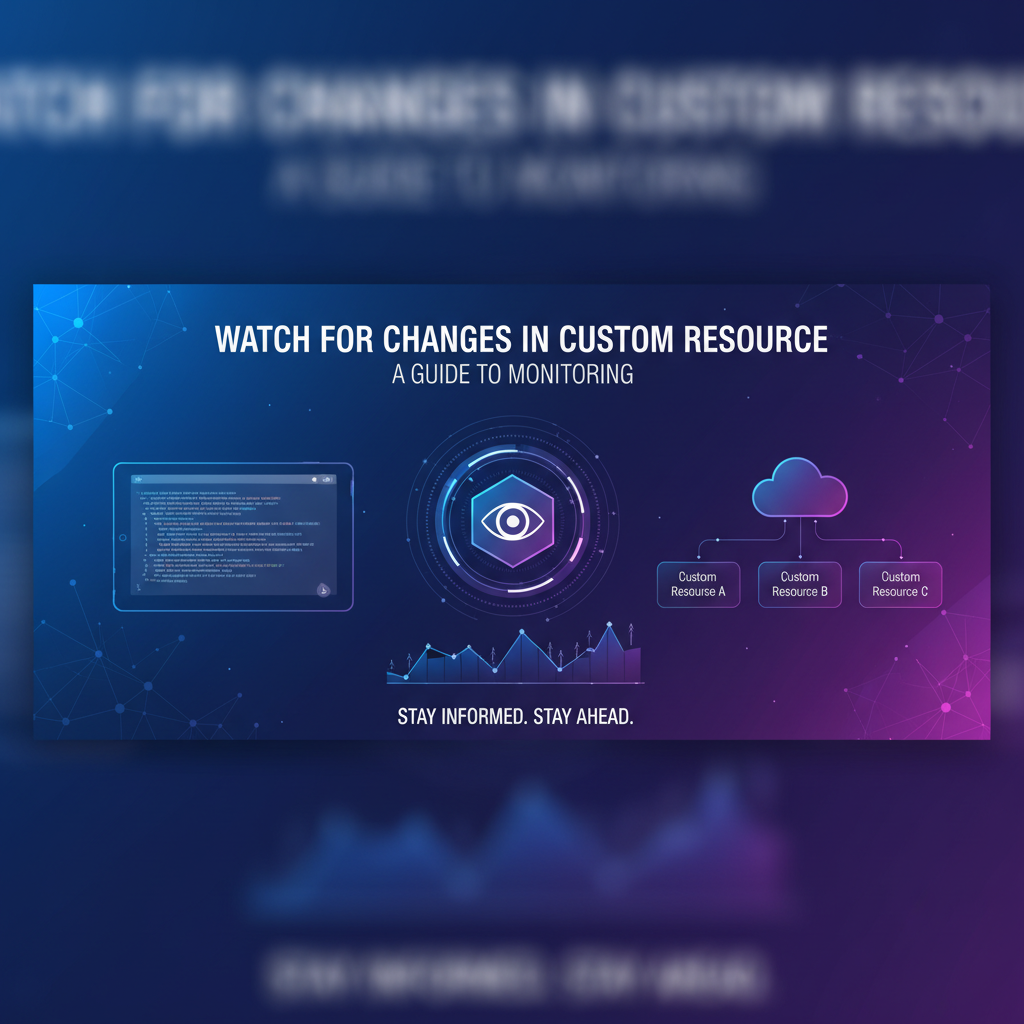
Watch for Changes in Custom Resource: A Guide to Monitoring


The landscape of modern software development is a vibrant, ever-shifting tapestry, particularly within the cloud-native ecosystem. Microservices, containerization, and orchestration platforms like Kubernetes have redefined how applications are built, deployed, and managed. At the heart of this paradigm shift lies a powerful concept: the ability to extend the platform itself to manage domain-specific resources. This is where Custom Resources (CRs) come into play, transforming Kubernetes from a generic container orchestrator into a highly specialized control plane for virtually any application or infrastructure component imaginable.
However, with great power comes the complex challenge of observation. In systems where custom resources are the very fabric of configuration and state, blindly trusting that everything is operating as intended is a perilous gamble. Just as a sailor meticulously watches the horizon for changing weather patterns, or an air traffic controller vigilantly monitors flight paths, engineers and operators must possess an acute awareness of the dynamic shifts occurring within their custom resources. The creation, modification, or deletion of a custom resource can have profound implications, triggering cascades of automated actions, reconfiguring critical infrastructure, or altering the very behavior of intelligent services, including those managed by an AI Gateway or LLM Gateway.
This comprehensive guide, "Watch for Changes in Custom Resource: A Guide to Monitoring," delves deep into the critical necessity of observing these mutations. We will explore the fundamental mechanisms Kubernetes provides for this task, the architectural patterns that leverage this capability, and the advanced strategies for building resilient, self-healing, and observable systems. Our journey will illuminate why effective monitoring of custom resources is not merely a best practice, but an absolute imperative for maintaining stability, security, and performance in today's intricate, automated environments, drawing connections to the broader role of an API Gateway in this ecosystem.
Part 1: The Foundation - Understanding Custom Resources and Their Significance
To truly appreciate the art of monitoring custom resource changes, one must first grasp the essence of what custom resources are and why they have become an indispensable part of the cloud-native toolkit. They represent a fundamental extension of the Kubernetes API, allowing users to define their own objects and manage them declaratively, just like native Kubernetes objects such as Pods, Deployments, or Services.
What are Custom Resources (CRs) and Custom Resource Definitions (CRDs)?
At its core, Kubernetes manages resources. A resource is an endpoint in the Kubernetes API that stores a collection of API objects of a certain kind. For example, the built-in Pod resource stores a collection of Pod objects. While Kubernetes provides a rich set of built-in resources to manage containers, networking, and storage, real-world applications often have unique, domain-specific requirements that go beyond these standard abstractions.
This is where Custom Resource Definitions (CRDs) enter the picture. A CRD is itself a Kubernetes resource that defines a new, custom resource kind. When you create a CRD, you are essentially telling Kubernetes: "Hey, I'm introducing a new type of object into your system. Here's its schema, its scope (namespace or cluster-wide), and its versioning information." Once a CRD is created, you can then create Custom Resources (CRs) of that new kind, which are instances of the schema defined by the CRD.
Imagine you're building a platform for managing machine learning models. You might want to define a MachineLearningModel object that encapsulates details like the model's training data, its version, its associated artifacts, and its deployment strategy. Instead of storing this information in a generic ConfigMap or an external database, you can define a MachineLearningModel CRD. Once defined, you can create MachineLearningModel CRs, like my-sentiment-analysis-model-v2 or fraud-detection-model-alpha, directly within Kubernetes. These CRs become first-class citizens, enjoying the same declarative management, versioning, and access control benefits as native Kubernetes objects.
Why are CRs Central to Modern Cloud-Native Architectures?
The advent of CRDs and CRs ushered in a new era of extensibility and automation within Kubernetes, making them central to modern cloud-native architectures for several compelling reasons:
- Domain-Specific Abstractions: CRs allow developers and operators to model their application domain directly within Kubernetes. This reduces the cognitive load, as all related configurations and states are represented using familiar Kubernetes idioms. Instead of interacting with low-level Pods and Services, one can interact with higher-level abstractions like
DatabaseInstance,MessageQueue,AIModelDeployment, orAPIRoute. This unification simplifies management and promotes a shared understanding across teams. - Operational Consistency and Declarative Management: Like all Kubernetes resources, CRs are managed declaratively. You define the desired state of your custom resource (e.g., "I want a
DatabaseInstanceof PostgreSQL version 15 with 2 replicas and 100GB storage"), and Kubernetes, through controllers, works tirelessly to reconcile the current state with this desired state. This eliminates manual configuration drift and ensures that your infrastructure and applications consistently meet specifications, even across multiple environments. - Empowering Operators and Automation: CRDs are the cornerstone of the Operator pattern. An Operator is a method of packaging, deploying, and managing a Kubernetes-native application. It extends the Kubernetes API with Custom Resources and uses controllers to automate complex operational tasks for stateful applications. For instance, a
KafkaOperatormight watch forKafkaClusterCRs and automatically provision Kafka brokers, manage upgrades, handle backups, and ensure disaster recovery, all without human intervention. This automation significantly reduces operational burden and human error. - Enabling Advanced Platforms and Services: Many sophisticated platforms built on Kubernetes leverage CRDs extensively. Service meshes use CRDs to define traffic routing, retry policies, and circuit breakers. Serverless frameworks use CRDs to define functions and event sources. Data platforms use CRDs to define data pipelines, storage buckets, and processing jobs. This extensibility allows Kubernetes to serve as a universal control plane, orchestrating not just containers, but entire application ecosystems.
The Inherent Challenge: Changes Are Dynamic and Critical
Despite their immense benefits, the dynamic nature of custom resources introduces a significant operational challenge. Because CRs define the desired state of critical components—from database configurations to AI model deployments or API Gateway routing rules—any change to a CR can trigger a cascade of events. A seemingly innocuous update to a MLModelVersion CR could initiate a new model deployment, modify traffic routing via an LLM Gateway, or even trigger resource scaling.
These changes can originate from various sources: a developer deploying a new version via GitOps, an automated system reacting to an external event, or even a misconfiguration. Without a robust mechanism to observe and understand these changes, operators are flying blind. They might miss critical updates, fail to detect unauthorized modifications, struggle to diagnose issues rooted in an altered CR state, or be unable to audit who changed what and when. This lack of visibility can lead to system instability, security vulnerabilities, compliance breaches, and prolonged incident resolution times. This brings us to the imperative of monitoring custom resource changes.
Part 2: The Imperative of Monitoring Custom Resource Changes
The very dynamism that makes Custom Resources so powerful also makes their monitoring absolutely essential. In a world where infrastructure and application configurations are increasingly codified and managed through Kubernetes APIs, changes to these custom definitions are not just data points; they are operational events with potentially far-reaching consequences. Neglecting to monitor these changes is akin to managing a complex financial system without tracking transactions—you're guaranteed to run into trouble.
Why is Monitoring CR Changes Not Just Good Practice, But Essential?
Let's dissect the multifaceted reasons why vigilant monitoring of Custom Resource changes is an absolute imperative:
- Operational Stability and Desired State Enforcement: The core promise of Kubernetes is declarative management: you define the desired state, and the system ensures that state is met. CRs extend this promise to custom domains. When a CR changes, it signifies a new desired state. Monitoring these changes allows you to confirm that controllers are reacting as expected, that the system is converging towards the new state, and that no unintended deviations occur. For instance, if a
DatabaseInstanceCR is updated to request more memory, you need to know if the underlying database operator successfully resized the instance. Failure to do so could mean a crucial service is starved of resources, leading to performance degradation or outages. Moreover, it helps in detecting "drift" from the desired state, where a CR might be manually altered outside of approved GitOps pipelines, potentially introducing inconsistencies. - Security: Detecting Unauthorized Modifications and Policy Enforcement: Custom Resources often hold sensitive configurations or define critical operational parameters. A malicious actor or an accidental misconfiguration could alter a
NetworkPolicyCR, opening up unintended ingress, or modify anAIModelAccessCR, granting unauthorized access to an intelligent service exposed via an AI Gateway. By monitoring changes, security teams can detect anomalous activity in real-time. Integrating CR change monitoring with security information and event management (SIEM) systems enables rapid response to potential breaches. Furthermore, it helps enforce policies: if a CR is changed in a way that violates a defined organizational policy (e.g., using an unapproved image tag in anApplicationDeploymentCR), the change can be immediately flagged and potentially reverted. - Auditing and Compliance: Tracking Changes for Regulatory Purposes: In many industries, compliance with regulatory standards (e.g., GDPR, HIPAA, SOC 2) requires a detailed audit trail of all changes to critical systems and data. Custom Resources, by their very nature, encapsulate critical system configurations. Monitoring every creation, update, and deletion of a CR, along with who initiated the change and when, provides an invaluable audit log. This data is essential during compliance audits, demonstrating due diligence and accountability. Without such a record, proving compliance becomes a significant challenge, potentially leading to fines or reputational damage.
- Automation and Reactivity: Triggering Workflows and Self-Healing: The cloud-native paradigm thrives on automation. CR changes are often the triggers for automated workflows. An update to a
DataPipelineCR might automatically kick off a new data processing job. A change in anApplicationScaleCR could trigger Horizontal Pod Autoscalers or custom scaling logic. Beyond simple triggers, monitoring allows for sophisticated self-healing mechanisms. If a controller observes an invalid state in a CR, or if a critical field in a CR unexpectedly changes, an automated remediation workflow can be initiated. For example, if aBackupScheduleCR is deleted, the system could automatically recreate a default one to ensure data protection continues, or at least alert an operator. - Debugging and Troubleshooting: Pinpointing the Cause of Issues: When something goes wrong in a complex distributed system, the immediate question is "What changed?" Without visibility into CR modifications, diagnosing issues can be a nightmare. Imagine an API Gateway suddenly exhibiting incorrect routing behavior, or an LLM Gateway failing to serve specific models. A key first step in troubleshooting would be to review recent changes to relevant CRs, such as
APIRouteCRs orLLMConfigurationCRs. Monitoring provides the "smoking gun," quickly pointing to a recent CR update as the potential root cause, drastically shortening Mean Time To Resolution (MTTR). This historical context is invaluable for engineers trying to unravel the intricate web of dependencies and interactions within a microservices architecture.
Consequences of Neglecting CR Change Monitoring
The repercussions of neglecting to monitor custom resource changes can range from minor annoyances to catastrophic failures:
- Silent Failures: Critical configurations might drift, leading to degraded performance or outright service outages that go undetected until users complain.
- Security Breaches: Unauthorized changes to security-related CRs could expose sensitive data or services, potentially leading to data loss, compliance violations, and significant financial and reputational damage.
- Compliance Penalties: Lack of an audit trail for CR changes can lead to hefty fines and legal complications, especially in regulated industries.
- Prolonged Outages: Without clear insight into what changed, troubleshooting becomes a tedious, time-consuming process of sifting through logs and configurations, significantly extending incident resolution times.
- Reduced Automation Effectiveness: Controllers might operate on outdated or incorrect CR states, leading to inefficient resource utilization, inconsistent deployments, or even conflicting automated actions.
- Operational Blindness: Teams lose confidence in their deployments because they lack the visibility to understand the current state and how it evolved. This breeds distrust in automation and can lead to a return to manual, error-prone processes.
In essence, monitoring custom resource changes is about maintaining control, ensuring reliability, and building trust in the automated cloud-native ecosystem. It's the critical observability layer that turns a black box of automation into a transparent and manageable system.
Part 3: Mechanisms for Observing Custom Resource Changes
Kubernetes, by its very design, is built around the concept of observing and reacting to changes in its API objects. This fundamental capability extends seamlessly to Custom Resources. Understanding these mechanisms is crucial for anyone looking to build robust monitoring solutions or resilient operators. From the raw API watch mechanism to higher-level eventing and metrics, several tools and approaches allow us to keep a vigilant eye on CR mutations.
Kubernetes API Watch: The Fundamental Mechanism
The most direct and fundamental way to observe changes in any Kubernetes API object, including Custom Resources, is through the Kubernetes API's "watch" mechanism. This is the bedrock upon which all Kubernetes controllers and operators are built.
How it Works (Long-Polling, Event Streams): When a client (like kubectl, a custom controller, or a monitoring agent) wants to watch a resource, it makes an HTTP GET request to the Kubernetes API server for a specific resource type (e.g., /apis/stable.example.com/v1/customresources), adding the watch=true query parameter. The API server doesn't immediately respond with a snapshot of the current state. Instead, it holds the connection open, sending back a stream of events as changes occur. This is often referred to as HTTP long-polling or Server-Sent Events (SSE).
Each event in the stream describes a change that happened to a specific object:
- ADDED: An object was created.
- MODIFIED: An existing object was updated.
- DELETED: An object was removed.
Crucially, each event also includes the current state of the object (for ADDED and MODIFIED events) and a resourceVersion. The resourceVersion is an opaque value (an integer) representing the state of the API server's storage at the time the object was retrieved or modified. Clients use this resourceVersion to resume watching from a specific point, ensuring they don't miss any events if their connection is interrupted. They can also use it to get a consistent snapshot of resources up to a certain point in time.
Client-Side Libraries (Go client-go, Python kubernetes-client): While you could theoretically make raw HTTP requests, interacting with the Kubernetes API watch mechanism directly is complex. Fortunately, official client libraries abstract away much of this complexity.
- Go
client-go: This is the canonical client library, used by Kubernetes itself and most operators. It providesInformerandSharedInformerpatterns. AnInformercontinuously watches the API server, caches the current state of resources locally, and calls user-defined event handlers (AddFunc,UpdateFunc,DeleteFunc) when changes occur.SharedInformersallow multiple controllers within the same process to share a single watch connection and cache, reducing load on the API server. This is the most robust and performant way to build reactive components. - Python
kubernetes-client: The Python client also offers watch capabilities, allowing developers to set up event listeners for specific resource types. While perhaps not as optimized for high-volume, continuous watching asclient-goinformers, it's excellent for scripting and simpler integrations.
Limitations for Large-Scale Deployments: While powerful, direct API watching and even informers have limitations in extremely large-scale, multi-cluster environments:
- API Server Load: Each watch connection consumes resources on the API server. Thousands of individual watches from various components can put a significant strain on the control plane. Shared informers mitigate this by reducing redundant connections.
- Client Complexity: Writing robust watch logic that handles reconnections, error conditions, and
resourceVersionmanagement can be intricate. - Event Retention: The Kubernetes API server generally only retains a limited history of
resourceVersions. If a client's watch connection is down for too long, it might fall behind the availableresourceVersionwindow and require a full resync (listing all objects) rather than just resuming the watch.
Controllers and Operators: The Core of Kubernetes Automation
Controllers and Operators are the primary consumers of the Kubernetes API watch mechanism, translating observed changes into automated actions. They embody the "control loop" or "reconciliation loop" pattern, constantly striving to move the current state of the cluster towards the desired state defined by resources.
Reconciliation Loops: A controller's fundamental job is to "reconcile" the current state with the desired state. For Custom Resources, this means:
- Watch: The controller uses
Informersto watch forADDED,MODIFIED, orDELETEDevents for its target CRDs. - Queue: When an event occurs for a CR it manages, the controller adds the CR's key (namespace/name) to a work queue.
- Process: The controller picks items from the work queue, retrieves the current state of the corresponding CR from its local cache, and fetches any related Kubernetes objects (e.g., Pods, Deployments, Services) that the CR is meant to manage.
- Reconcile: It then compares the current state of these objects with the desired state specified in the CR. If there's a discrepancy, it takes action (e.g., creates a new Pod, updates a Deployment, deletes an old Service) to bring the system closer to the desired state.
- Update Status: Finally, it updates the
statussub-resource of the CR to reflect the actual state, providing feedback to users and other controllers.
Building Custom Controllers (Operator SDK, Kubebuilder): While you can write a controller from scratch using client-go, tools like Operator SDK and Kubebuilder significantly streamline the development process. They provide scaffolding, code generation, and best practices for creating robust, production-ready operators. These tools abstract away much of the boilerplate, allowing developers to focus on the core reconciliation logic specific to their custom resource.
How They Naturally Observe and React to CR Changes: The very nature of operators means they are inherently "watching for changes in custom resources." They are designed to be event-driven. An operator managing KafkaCluster CRs will instantly know when a user requests a new Kafka cluster (ADDED), modifies an existing one's replica count (MODIFIED), or decides to tear down a cluster (DELETED). This immediate reaction is the magic that enables self-healing, automated provisioning, and complex stateful application management within Kubernetes.
Kubernetes Eventing and Audit Logs
Beyond direct API watches, Kubernetes provides other vital sources of information about changes, particularly useful for retrospective analysis and higher-level monitoring.
System Events (Creation, Update, Deletion): Kubernetes generates system events for many actions, including the creation, modification, and deletion of resources. These events are small messages that indicate "something happened to an object at this time." You can view these events using kubectl get events. For instance, when a Custom Resource is created, you'll often see an ADDED event. These are high-level, ephemeral notifications, typically stored for a short period (usually an hour) and primarily used for quick debugging. They can be consumed by external tools or integrated into monitoring dashboards for an overview of cluster activity.
Audit Logs for Comprehensive Historical Records: Kubernetes audit logs are a much more comprehensive and persistent record of activity within the cluster. The Kubernetes API server can be configured to record every request it receives, including:
- Who made the request (user or service account).
- What they did (API verb like
create,update,delete,get,list,watch). - Which resource was affected (including CRs).
- When the request happened.
- From where the request originated.
- The request and response bodies (configurable detail levels).
This granular detail is invaluable for security forensics, compliance auditing, and deep troubleshooting. Audit logs capture not just that a CR was modified, but the exact change that was requested in the API call. They can be streamed to a file, a webhook, or directly to external logging solutions like Elasticsearch, Splunk, or cloud-native logging services.
Integrating with External SIEM/Logging Systems: For long-term storage, advanced querying, and correlation with other system logs, audit logs are typically integrated with external Security Information and Event Management (SIEM) or centralized logging systems. This allows operations and security teams to build dashboards, set up alerts for suspicious activity (e.g., unauthorized attempts to modify a critical CR), and perform detailed historical analysis.
Metrics and Alerts
While watching events and logs provides granular detail, metrics and alerts offer aggregated, real-time insights into the state of Custom Resources and the impact of their changes.
Custom Metrics for CR States: Operators can expose custom metrics about the Custom Resources they manage. For example, an operator managing ApplicationDeployment CRs might expose:
application_deployment_total: A gauge showing the total number ofApplicationDeploymentCRs.application_deployment_ready_total: A gauge showing how manyApplicationDeploymentCRs are currently in a "ready" state (based on their status sub-resource).application_deployment_status_transition_duration_seconds: A histogram tracking how long it takes for anApplicationDeploymentto transition from "pending" to "ready" after a change.
These metrics provide a high-level view of the health and progression of your custom resources.
Prometheus and Alertmanager Integration: Prometheus is the de facto standard for monitoring in Kubernetes. Operators can expose their custom metrics in a Prometheus-compatible format. Prometheus then scrapes these metrics at regular intervals.
Defining Meaningful Alerts Based on CR Attributes: Once metrics are collected, Alertmanager (often integrated with Prometheus) can be used to define alerting rules. For example:
- Alert:
CustomResourceStuckInPending- Condition:
application_deployment_ready_total{status="pending"} > 5for 5 minutes (more than 5 applications have been stuck in pending for too long).
- Condition:
- Alert:
CriticalConfigMismatch- Condition:
api_gateway_route_cr_status_diverged_from_desired_total > 0(indicating an API Gateway CR's actual state doesn't match its desired state).
- Condition:
These alerts allow operators to be proactively notified when something is amiss with their custom resources, often before it impacts end-users.
External Monitoring Tools and Platforms
A plethora of third-party tools and commercial platforms specialize in Kubernetes monitoring, often extending beyond native capabilities to offer richer visualization, analytics, and integrations.
- Specialized Tools: Tools like Datadog, New Relic, Grafana Cloud, and Dynatrace offer agents that integrate with the Kubernetes API, scrape Prometheus metrics, and consume audit logs and events. They can often provide richer context by correlating CR changes with other infrastructure metrics (e.g., CPU, memory, network I/O) and application performance data.
- Visualizing CR States and Changes: Many of these platforms provide intuitive dashboards and UIs to visualize the status of Custom Resources, track their changes over time, and even show dependencies between CRs and other Kubernetes objects. This graphical representation can be invaluable for understanding complex interdependencies and quickly spotting anomalies.
- Dashboards and Reporting: They allow for the creation of custom dashboards to monitor the health and activity of CRs relevant to specific teams or applications. Advanced reporting features can generate summaries of CR changes over time, useful for management reviews or compliance reporting.
By combining these mechanisms—from the low-level API watch to high-level external platforms—organizations can construct a comprehensive and multi-layered approach to monitoring changes in Custom Resources, ensuring they have the visibility required to operate complex cloud-native systems effectively.
APIPark is a high-performance AI gateway that allows you to securely access the most comprehensive LLM APIs globally on the APIPark platform, including OpenAI, Anthropic, Mistral, Llama2, Google Gemini, and more.Try APIPark now! 👇👇👇
Part 4: Architecting for Robust CR Change Monitoring
Building an effective system for monitoring Custom Resource changes goes beyond merely understanding the individual mechanisms; it requires thoughtful architectural design. This involves selecting the right tools, integrating them cohesively, and adopting best practices that ensure both coverage and efficiency. Critically, this architecture must also consider the role of crucial components like API Gateways, AI Gateways, and LLM Gateways, which themselves might be configured or influenced by Custom Resources.
Design Principles
When architecting a system to monitor CR changes, certain principles should guide your decisions:
- Idempotency in Controllers: Any controller or automated system reacting to CR changes must be idempotent. This means applying the same change multiple times should have the same effect as applying it once. This is crucial because watch events can sometimes be replayed or processed out of order. Idempotent operations prevent unintended side effects and ensure consistency.
- Granularity of Monitoring: Determine the appropriate level of detail required for monitoring. Not every field in every CR needs real-time alerting. Identify critical CRs and critical fields within those CRs that warrant immediate attention upon modification. For less critical changes, audit logs or periodic reports might suffice.
- Separation of Concerns: Clearly delineate responsibilities. One component might be responsible for watching CRs, another for logging changes, and a third for generating alerts. This modularity improves maintainability and allows for independent scaling and evolution of different monitoring aspects. For instance, the AI Gateway might have its own internal monitoring for model performance, while a separate system monitors the CRs that define the AI models themselves.
- Least Privilege: Ensure that any monitoring component or operator only has the necessary Kubernetes Role-Based Access Control (RBAC) permissions to perform its function. For example, a logger should only have
getandlistpermissions for CRs, notupdateordelete, unless it's part of an automated remediation system. - Observability from the Start: Integrate monitoring into the design of your Custom Resources and their associated controllers. CRDs should have well-defined schemas, and controllers should expose metrics and update CR
statusfields effectively, providing clear indicators of their state and progression.
Choosing the Right Tools
The choice of tools will depend on your specific needs, existing ecosystem, and team expertise:
- Native Kubernetes vs. Third-Party: Leverage native Kubernetes features (API watch, audit logs,
client-goinformers) as the foundational layer. For advanced analytics, visualization, and cross-platform correlation, augment with battle-tested third-party solutions (Prometheus, Grafana, Datadog, Splunk). - Balancing Complexity and Coverage: Don't over-engineer. Start with simpler monitoring for critical CRs and gradually expand. A
client-goinformer coupled with basic logging might be sufficient for a simple CR, while a complexApplicationPlatformCR might warrant a dedicated operator, Prometheus metrics, and integration with a sophisticated observability platform. - Cost Considerations: Open-source tools like Prometheus and Grafana offer powerful capabilities with minimal licensing costs, primarily incurring operational overhead. Commercial platforms often provide managed services and richer features but come with subscription fees.
Integrating with CI/CD Pipelines
A robust CR change monitoring strategy is tightly coupled with modern CI/CD and GitOps practices:
- Automated Testing of CRDs and Controllers: Before deploying any CRD or controller, thoroughly test its behavior. Unit tests, integration tests, and end-to-end tests should validate that CRs are processed correctly, and that expected changes trigger the right actions. This includes testing how controllers react to various CR
ADDED,MODIFIED, andDELETEDevents. - GitOps Approach for CR Management: Store all Custom Resource definitions and instances in a Git repository. Use GitOps tools (like Argo CD or Flux CD) to automatically synchronize these definitions with the Kubernetes cluster. This provides a single source of truth, an inherent audit trail (Git commit history), and ensures that all CR changes go through a controlled, versioned process. Any divergence between the Git state and the cluster state can trigger alerts, serving as an effective form of CR change monitoring.
The Role of Gateways in a CR-Managed Ecosystem (Keyword Integration: API Gateway, AI Gateway, LLM Gateway)
Gateways – whether they are general-purpose API Gateways, specialized AI Gateways, or focused LLM Gateways – play a pivotal role in modern cloud-native architectures. They are often the first point of contact for external traffic, routing requests to various backend services. Crucially, their configurations are increasingly defined and managed through Custom Resources within Kubernetes, making their CR change monitoring a high-stakes endeavor.
API Gateway Configuration via Custom Resources
An API Gateway acts as the single entry point for a multitude of microservices. It handles common concerns like routing, load balancing, authentication, rate limiting, and analytics. In Kubernetes, API Gateways are frequently configured using CRs.
- Ingress and Gateway API: Standard Kubernetes Ingress resources and the newer, more powerful Gateway API (with its
Gateway,HTTPRoute,TCPRoute, etc., CRs) are prime examples. Changes to anHTTPRouteCR can instantly alter how traffic is directed to your services. Monitoring these changes is critical to ensure traffic flows correctly, to prevent misrouting, or to detect unauthorized changes that might expose internal services. - Custom CRDs for Gateway Policies: Beyond standard APIs, many organizations define their own CRDs for more granular API Gateway policies, such as
RateLimitPolicy,AuthenticationPolicy, orCORSConfiguration. If your gateway dynamically reloads its configuration based on these CRs, then observing changes in these CRs is directly tied to the operational behavior and security of your API endpoints. A subtle change in aRateLimitPolicyCR could inadvertently throttle legitimate traffic or, conversely, open a service to denial-of-service attacks.
APIPark: An Advanced AI Gateway & API Management Platform
When discussing advanced AI Gateways, it's opportune to highlight solutions that embody the power of flexible configuration and comprehensive management. APIPark, an open-source AI gateway and API management platform, is an excellent example of a system where internal configurations, potentially managed or influenced by custom resources, are paramount for AI service delivery.
APIPark is designed to streamline the management, integration, and deployment of both AI and REST services. In a Kubernetes environment, many of APIPark's advanced capabilities could theoretically be driven by custom resource definitions.
- Quick Integration of 100+ AI Models: Imagine
AIModelCRs defining the existence and version of various AI models. APIPark, as the AI Gateway, could watch these CRs, automatically integrate new models, and expose them through a unified management system for authentication and cost tracking. Monitoring changes in theseAIModelCRs ensures new models are correctly onboarded and old ones are decommissioned. - Unified API Format for AI Invocation: If
AIInvocationPolicyCRs define how different AI models should standardize request formats, APIPark would implement this. Any change to such a CR would directly impact how applications interact with AI services, making CR change monitoring vital for maintaining application compatibility and reducing maintenance costs. - Prompt Encapsulation into REST API: Users can combine AI models with custom prompts to create new APIs. A
PromptAPICR could define such a new API (e.g., a sentiment analysis API). APIPark, as the AI Gateway, would expose this. Monitoring changes toPromptAPICRs means tracking the evolution of your AI-driven microservices. - End-to-End API Lifecycle Management: APIPark assists with managing the entire lifecycle of APIs. If API definitions, traffic forwarding rules, load balancing, and versioning are influenced by
APIDefinitionorAPIRouteCRs, then observing these CR changes becomes crucial for regulating API management processes within APIPark. - Independent API and Access Permissions for Each Tenant: In multi-tenant deployments,
TenantConfigurationCRs might define independent applications, data, and security policies. APIPark supports such multi-tenancy. Monitoring changes in these CRs ensures tenant isolation and correct permission enforcement.
The gateway itself, whether it's APIPark or another solution, becomes a critical monitoring point. It emits its own metrics and logs about traffic, errors, and performance. However, these operational metrics are significantly enriched by understanding the underlying CR changes that caused a shift in gateway behavior or configuration. If APIPark, for instance, suddenly reports errors for a specific AI model, reviewing recent AIModel or PromptAPI CR changes would be a crucial diagnostic step.
LLM Gateway: Specializing in Large Language Models
An LLM Gateway is a specialized form of an AI Gateway focusing specifically on Large Language Models. These gateways might handle routing requests to different LLM providers (OpenAI, Anthropic, custom fine-tuned models), manage prompt engineering, apply rate limits per model, and ensure data privacy.
- LLM Configuration CRs: Custom Resources like
LLMDeployment,LLMRateLimitPolicy, orPromptTemplateCRs could define the entire operational surface of your LLM services. ALLMDeploymentCR might specify which LLM version to use, its resource allocation, and its exposure parameters. APromptTemplateCR might define standard prompts for specific use cases. - Impact of Changes: Monitoring changes in these CRs ensures that:
- New LLM versions are deployed correctly and safely.
- Rate limits are adjusted appropriately, preventing costly overages or service degradation.
- Prompt templates are updated consistently across applications.
- Security policies for LLM access are maintained.
In essence, whether we're talking about a generic API Gateway, an advanced AI Gateway like APIPark, or a specialized LLM Gateway, their effective operation is often intertwined with the declarative power of Custom Resources. Monitoring changes in these configuration-driving CRs is thus paramount to ensuring the stability, security, and performance of the critical gateway layer, and by extension, the entire application ecosystem.
Part 5: Advanced Techniques and Best Practices
As cloud-native environments mature and grow in complexity, the need for sophisticated Custom Resource change monitoring also escalates. Moving beyond basic observation, advanced techniques focus on proactive management, automated enforcement, and intelligent remediation, building truly resilient systems.
Event-Driven Architectures
Decoupling the act of observing a change from the act of reacting to it can significantly enhance scalability, flexibility, and fault tolerance.
- Using Kafka or NATS to Stream CR Change Events: Instead of every component directly watching the Kubernetes API, a central "event sink" can watch for CR changes and publish these events to a message broker like Apache Kafka or NATS. Other services then subscribe to these topics, consuming only the events relevant to them.
- Benefits: This pattern reduces the load on the Kubernetes API server (fewer watch connections), provides a durable log of events (Kafka), enables asynchronous processing, and allows for much greater fan-out to multiple consumers without impacting the API server.
- Use Case: An AI Gateway monitoring its
AIModelCRs might publish an "AI Model Updated" event to Kafka. A data science team's metrics service could subscribe to this to update its dashboard, while a separate audit service logs the change, and a notification service alerts relevant stakeholders.
- Decoupling Observers from Reactors: This architecture allows observers (e.g.,
client-goinformers) to focus solely on detecting changes, while reactors (downstream services, functions) can independently process these changes at their own pace, handling retries and potential failures without blocking the event stream. This also enables different teams to build their own reactive components without tightly coupling them to the Kubernetes control plane internals.
Policy Enforcement with Admission Controllers
While monitoring detects changes after they happen, Admission Controllers offer a powerful way to intercept and validate changes before they are persisted to the Kubernetes API, providing a proactive layer of security and policy enforcement.
- Mutating and Validating Webhooks:
- Mutating Admission Webhooks: These can modify incoming requests to the Kubernetes API server before an object is saved. For example, a mutating webhook could automatically inject default labels or annotations into every new
ApplicationDeploymentCR, or normalize certain fields to ensure consistency. This helps enforce standards without requiring users to manually add boilerplate. - Validating Admission Webhooks: These check if an incoming request is valid. If a request attempts to create or update a Custom Resource in a way that violates a defined policy (e.g., an
AIModelCR specifies an unsupported model version, or anAPIRouteCR attempts to expose a sensitive internal endpoint without proper authentication), the webhook can reject the request, preventing the invalid CR from ever being stored.
- Mutating Admission Webhooks: These can modify incoming requests to the Kubernetes API server before an object is saved. For example, a mutating webhook could automatically inject default labels or annotations into every new
- Preventing Invalid CR Configurations Before They Are Applied: By using admission controllers, you shift from reactive detection to proactive prevention. This is especially critical for security-sensitive CRs (like network policies, access controls, or gateway configurations) and for maintaining the integrity of configurations managed by operators. It reduces the need for complex reconciliation logic to fix invalid states and lessens the burden on monitoring systems to detect non-compliant changes. Tools like OPA Gatekeeper (Open Policy Agent) provide a flexible framework for defining and enforcing such policies.
Snapshotting and Versioning
Maintaining a historical record of Custom Resource states is crucial for auditing, debugging, and recovery.
- Maintaining a History of CR States: Beyond simple audit logs that record requests, having a versioned history of the actual state of CRs over time can be invaluable. This can be achieved by:
- GitOps: If CRs are managed via GitOps, the Git commit history provides an inherent version history.
- External Storage: Periodically taking snapshots of critical CRs and storing them in an external database or object storage (e.g., S3, Google Cloud Storage).
- Custom Operators: An operator could itself maintain a history of the CRs it manages, storing previous versions in a dedicated "history" CR or an external system.
- Rollback Capabilities: A versioned history enables quick rollbacks. If a recent change to an
APIRouteCR orLLMConfigurationCR causes unforeseen issues, you can easily revert to a previous, known-good version of that CR, leveraging the declarative nature of Kubernetes to restore the desired state. This dramatically reduces recovery time during incidents.
Automated Remediation
The ultimate goal of monitoring is not just to detect problems, but to fix them, ideally automatically.
- Triggering Scripts or Workflows in Response to Specific CR Changes: When a monitoring system detects a critical or anomalous change in a CR (e.g., a
DatabaseInstanceCR enters a "failed" state after an update, or anAIModelCR is modified with an unsupported parameter), it can automatically trigger a script or a sophisticated workflow.- Examples:
- If an
ApplicationDeploymentCR fails to reconcile after an update, an automated workflow could try restarting dependent services, roll back the CR to its previous version, or open an incident ticket in an issue tracker. - If an LLM Gateway configuration CR shows an outdated token, an automated system could try refreshing the token from a secure vault and updating the CR.
- If an
- Examples:
- Self-Healing Systems: By integrating CR change monitoring with automated remediation, you build self-healing systems. These systems can detect deviations from the desired state or respond to critical changes without human intervention, leading to higher availability and resilience. However, great care must be taken when designing automated remediation to avoid unintended consequences or infinite loops of corrective actions.
Security Considerations
Security must be an integral part of any CR change monitoring strategy.
- RBAC for Accessing CRs and Monitoring Tools:
- Least Privilege Principle: Ensure that users, service accounts, and monitoring agents only have the minimum necessary RBAC permissions to interact with Custom Resources. For example, a monitoring agent only needs
getandlistpermissions for CRs, notupdateordelete. Controllers needupdateandpatchpermissions for the CRs they manage and the resources they create. - Auditing RBAC: Regularly audit the RBAC policies to ensure they are secure and correctly configured, especially for sensitive CRs like those controlling API Gateways or AI Gateways.
- Least Privilege Principle: Ensure that users, service accounts, and monitoring agents only have the minimum necessary RBAC permissions to interact with Custom Resources. For example, a monitoring agent only needs
- Secure Logging and Data Retention:
- Sensitive Data: Be mindful of sensitive information within CRs (e.g., API keys, database credentials if not managed by external secrets managers). Ensure that logging systems are configured to mask or redact such data before storage, or that logs are stored in secure, access-controlled locations.
- Compliance: Adhere to data retention policies required by compliance standards for audit logs and CR change history. Securely store and archive logs, ensuring their integrity and immutability.
By adopting these advanced techniques and adhering to robust best practices, organizations can move beyond basic observation to build highly resilient, secure, and self-managing cloud-native environments where Custom Resource changes are not just observed, but intelligently managed, controlled, and even automatically remediated. This proactive stance is crucial for operating at scale and maintaining stability in dynamic, complex systems.
Part 6: Practical Implementation Scenarios and Examples
To solidify our understanding, let's explore a few practical scenarios where monitoring Custom Resource changes is not just beneficial, but absolutely critical. These examples will illustrate how the concepts discussed throughout this guide apply in real-world cloud-native deployments, including those leveraging various types of gateways. We will also include a comparative table of monitoring approaches.
Scenario 1: Monitoring a Custom Database CR
Consider a custom resource named DatabaseInstance that defines the desired state of a database, such as PostgreSQL. An operator is responsible for provisioning, managing, and maintaining these database instances.
- CR Structure Example:
yaml apiVersion: stable.example.com/v1 kind: DatabaseInstance metadata: name: my-app-db namespace: default spec: engine: postgresql version: "15.2" replicas: 2 storageSize: "100Gi" backupSchedule: "0 2 * * *" status: state: Running readyReplicas: 2 provisionedStorage: "100Gi" connectionString: "postgres://user:pass@my-app-db.default.svc.cluster.local:5432/myapp" - Changes in Desired State (Version, Replicas, Storage):
- Developer Action: A developer wants to upgrade
my-app-dbto PostgreSQL16.0and increase storage to200Gi. They update theDatabaseInstanceCR in Git and apply it via GitOps. - Monitoring Focus:
- Audit Logs: Track who initiated the
UPDATEoperation onmy-app-dbCR and when. This provides an immediate audit trail for the change. - Controller Watch: The database operator's informer immediately detects the
MODIFIEDevent formy-app-db. - Metrics & Status: The operator starts performing the upgrade and resizing. It updates the
status.statetoUpgradingorResizing. Custom metrics (e.g.,database_instance_state_transitions_total{state="Upgrading"}) are emitted. - Alerts: An alert could be configured if
status.stateremainsUpgradingfor an unusually long time, or if it transitions to aFailedstate. An alert could also fire ifstatus.readyReplicasdrops unexpectedly during the upgrade.
- Audit Logs: Track who initiated the
- Operational Value: Operators can monitor the progression of database changes, troubleshoot if an upgrade stalls, and quickly revert the CR if the new version causes issues, ensuring database stability and data integrity.
- Developer Action: A developer wants to upgrade
Scenario 2: Monitoring an AI Model Deployment CR
In an AI-driven application, a AIModelDeployment custom resource might define how a specific machine learning model should be deployed and exposed. This is where an AI Gateway would play a crucial role.
- CR Structure Example:
yaml apiVersion: ai.example.com/v1 kind: AIModelDeployment metadata: name: sentiment-analysis-v2 namespace: ai-models spec: modelName: "sentiment-classifier" modelVersion: "2.1.0" resourceLimits: cpu: "2" memory: "4Gi" replicas: 3 exposure: apiPath: "/techblog/en/v1/sentiment" authentication: required config: threshold: 0.7 language: "en" status: state: Deployed readyReplicas: 3 deployedVersion: "2.1.0" endpoint: "https://ai-gateway.example.com/v1/sentiment" - Changes in Model Version, Resource Allocation, Exposure Through an AI Gateway:
- Data Scientist Action: A data scientist updates
sentiment-analysis-v2CR to usemodelVersion: "2.2.0"(a new, improved model) and increasesreplicasto5due to anticipated higher load. - Monitoring Focus:
- Admission Webhook: A validating webhook could check if
modelVersion "2.2.0"exists in the model registry and is approved for production before allowing the CR update. A mutating webhook could inject default security headers into theexposureconfiguration. - Controller & APIPark: The
AIModelDeploymentoperator detects theMODIFIEDevent. It starts the deployment of the new model version. Concurrently, APIPark, as the configured AI Gateway (which might be watching forAIModelDeploymentCRs or receiving events from the operator), picks up the changes.- APIPark, being an open-source AI gateway and API management platform, would be configured to integrate the newly specified
modelVersion: "2.2.0". It might dynamically update its routing rules to point/v1/sentimentto the new version oncereadyReplicasare available, potentially using its "Unified API Format for AI Invocation" feature to ensure seamless transition. - APIPark's "Prompt Encapsulation into REST API" feature might also be relevant if this model is part of a larger prompt-based service, where changes in the
AIModelDeploymentCR could trigger updates to how those encapsulated APIs behave.
- APIPark, being an open-source AI gateway and API management platform, would be configured to integrate the newly specified
- Metrics: The operator exposes metrics like
ai_model_deployment_ready_replicas_total, which Prometheus scrapes. APIPark itself would also emit metrics on inference requests and latency for the/v1/sentimentendpoint. - Alerts: An alert could fire if
sentiment-analysis-v2status.stategets stuck inDeploying, or ifstatus.readyReplicasdoesn't matchspec.replicasfor too long. Alerts could also be set on APIPark's metrics if the error rate for/v1/sentimentspikes or latency increases significantly after the deployment.
- Admission Webhook: A validating webhook could check if
- Operational Value: This scenario highlights a tightly coupled system. Monitoring
AIModelDeploymentCRs ensures that new AI models are rolled out smoothly and securely. The AI Gateway (like APIPark) reacts to these changes, and its own operational metrics, combined with CR status, provide a comprehensive view of the AI service's health.
- Data Scientist Action: A data scientist updates
Scenario 3: Monitoring a Network Policy CR
Network policies are critical for securing traffic between pods in Kubernetes. Changes to these CRs can have immediate security implications.
- CR Structure Example:
yaml apiVersion: networking.k8s.io/v1 kind: NetworkPolicy metadata: name: deny-all-egress namespace: critical-app spec: podSelector: matchLabels: app: critical-service policyTypes: - Egress egress: - to: - ipBlock: cidr: 0.0.0.0/0 except: - 10.0.0.0/8 # Allow egress to internal network - 172.16.0.0/12 - Security Implications of Changes, Impact on Traffic Flow:
- Accidental Modification: A user accidentally modifies
deny-all-egressand removesexcept: 10.0.0.0/8, effectively blocking all egress fromcritical-serviceto the internal network. - Monitoring Focus:
- Audit Logs: Crucially, the audit log records the exact
UPDATErequest, including the modifiedegressrule, and who made the change. This is vital for forensic analysis. - Validating Webhook: A robust setup would have a validating webhook that flags changes to
NetworkPolicyCRs in critical namespaces, requiring peer review or specific security group approvals before allowing the change. If the change violated a corporate security standard, the webhook would reject it. - Controller Watch: While NetworkPolicy is a native Kubernetes CR, a custom controller could be watching for
MODIFIEDevents on criticalNetworkPolicyCRs. - Event-Driven Alerting: An event-driven system (e.g., watching audit logs for
NetworkPolicyupdates incritical-appnamespace, then publishing to Kafka) could trigger an immediate alert to the security team, detailing the change.
- Audit Logs: Crucially, the audit log records the exact
- Operational Value: Rapid detection of unauthorized or erroneous
NetworkPolicychanges is paramount. This prevents security breaches or application outages due to accidental traffic blocking. The audit trail is essential for compliance and post-mortem analysis.
- Accidental Modification: A user accidentally modifies
Comparative Analysis of CR Monitoring Approaches
Here's a table summarizing the different approaches to monitoring Custom Resource changes, along with their pros, cons, and best use cases.
| Monitoring Method | Pros | Cons | Best For |
|---|---|---|---|
| Kubernetes API Watch | Real-time event stream; Native to Kubernetes; Direct interaction with API server; Foundation for controllers. | Raw implementation can be complex (reconnections, resourceVersions); Can overload API server if too many direct watches; Limited event retention on API server side. | Building core controllers/operators; Real-time, low-latency reactions to specific CRs; Simpler custom tools needing immediate event notification. |
| Controllers/Operators | Automated reconciliation; Declarative state management; Self-healing capabilities; High customization. | Higher development effort; Specific to the domain of the CR; Requires careful design for idempotency and error handling; Can be a black box without good observability. | Complex automation logic for stateful applications; Managing lifecycle of custom domain objects (e.g., databases, AI models, message queues). |
| Kubernetes Audit Logs | Comprehensive historical record of all API requests; Includes "who, what, when, where"; Highly detailed (request/response bodies). | High volume of data; Requires external logging system for persistence and analysis; Post-hoc analysis (detects after the fact); Can be verbose and noisy. | Security forensics, compliance auditing; Detecting unauthorized access/modifications; Detailed post-mortem analysis of critical incidents. |
| Metrics & Alerts | Proactive notifications; Aggregated view of CR states/health; Integrates well with Prometheus/Grafana. | Requires controllers/operators to expose metrics; Only shows aggregate status, not individual change details; Can suffer from alert fatigue if not well-tuned. | High-level operational dashboards; Proactive alerting for critical state changes (e.g., "CR stuck in pending", "replica count mismatch"); SLO/SLA monitoring. |
| Admission Controllers | Proactive policy enforcement (mutating/validating); Prevents invalid CR configurations before they are applied. | Adds complexity to API request path; Requires careful testing to avoid blocking legitimate operations; Webhook latency can impact API server performance. | Enforcing security policies; Standardizing CR configurations; Preventing known misconfigurations; Compliance checks before persistence. |
| Event-Driven Architectures | Decoupled observers/reactors; Scalable event distribution (Kafka/NATS); Durable event log; Reduced API server load. | Adds external infrastructure (message broker); Increased complexity in overall architecture; Requires careful event schema design. | Large-scale, high-throughput systems; Microservices reacting to CR changes; Decoupling analytics/audit from direct control loop. |
| Snapshotting/Versioning | Enables quick rollbacks to previous CR states; Provides a robust historical record. | Requires external storage or sophisticated GitOps setup; Can consume significant storage for large/frequently changing CRs. | Disaster recovery; Detailed debugging of historical states; Compliance with long-term retention requirements. |
Each method offers a distinct angle on monitoring Custom Resource changes. A truly robust monitoring strategy will likely combine several of these approaches, creating a layered defense that ensures both granular real-time observation and comprehensive historical analysis. The specific blend will depend on the criticality of the CR, the desired level of automation, and the operational maturity of the organization.
Conclusion
The journey through the intricate world of Custom Resources and their monitoring reveals a fundamental truth of modern cloud-native operations: what you cannot observe, you cannot control. Custom Resources, by empowering operators to extend Kubernetes into virtually any domain, introduce unprecedented levels of automation and declarative management. Yet, this very power necessitates an equally sophisticated approach to monitoring the changes that govern these critical components.
We have explored the foundational importance of Custom Resources as the language of domain-specific automation in Kubernetes, and the compelling reasons why monitoring their every creation, modification, and deletion is not merely a technical exercise but an operational imperative. From ensuring system stability and security to aiding in compliance and enabling rapid troubleshooting, vigilance over CR changes forms the bedrock of resilient cloud-native infrastructures.
Our exploration delved into the diverse mechanisms available: the raw power of the Kubernetes API watch mechanism, the intelligent automation of controllers and operators, the forensic detail provided by audit logs, the proactive insights offered by metrics and alerts, and the preventive capabilities of admission controllers. We also discussed how modern architectures, leveraging event-driven patterns and robust CI/CD pipelines, can elevate CR change monitoring to new heights. Crucially, we highlighted the integral role of various gateways – the API Gateway, the AI Gateway (showcasing solutions like APIPark), and the specialized LLM Gateway – whose configurations are increasingly defined by Custom Resources, making their change monitoring directly impactful on critical traffic management and intelligent service delivery.
The cloud-native landscape, particularly with the rapid advancements in AI and Large Language Models, continues to evolve at an astonishing pace. The complexity of systems is only set to increase. As we integrate more intelligent services, manage more diverse data pipelines, and deploy more specialized applications through Kubernetes, the declarative power of Custom Resources will become even more pronounced. Consequently, the ability to watch for changes in these Custom Resources, to understand their implications, and to react intelligently and automatically, will distinguish resilient, high-performing organizations from those perpetually struggling with outages and operational chaos.
Building a truly observable and self-healing system demands a holistic approach, integrating these monitoring techniques into a coherent strategy. It means embracing GitOps for CR management, leveraging powerful platforms and open-source tools, and fostering a culture where observability is a first-class citizen in every development and deployment decision. By doing so, we don't just "watch for changes"; we actively understand, control, and ultimately master the dynamic heart of our cloud-native world, ensuring that our systems are not just running, but thriving in the face of constant evolution.
Frequently Asked Questions (FAQ)
1. What exactly is a Custom Resource (CR) in Kubernetes, and why is monitoring its changes important?
A Custom Resource (CR) extends the Kubernetes API, allowing users to define their own object types (like DatabaseInstance or AIModelDeployment) and manage them declaratively, just like native Kubernetes objects. A Custom Resource Definition (CRD) is what defines these new types. Monitoring changes in CRs is critical because they define the desired state of your applications and infrastructure. Any change can trigger automated actions, reconfigure critical services (including API, AI, or LLM Gateways), or introduce misconfigurations. Neglecting to monitor these changes can lead to operational instability, security vulnerabilities, compliance issues, and prolonged troubleshooting times.
2. How do Kubernetes Operators use Custom Resources, and how does this relate to monitoring?
Kubernetes Operators are applications that extend Kubernetes functionality to automate the management of complex, stateful applications (like databases or AI platforms). They do this by continuously "watching" for changes in specific Custom Resources. When a CR is created, updated, or deleted, the Operator's controller detects this change and takes action to reconcile the actual state of the application with the desired state defined in the CR. For monitoring, this means observing the Operator's behavior and the status field of the CR. If an Operator fails to update the CR's status after a change, or if the status indicates a problem, it signals an issue that requires attention.
3. What's the difference between monitoring CR changes using Kubernetes API Watch versus Audit Logs?
The Kubernetes API Watch mechanism provides a real-time stream of events (ADDED, MODIFIED, DELETED) for specific resources. It's the foundation for building reactive components like controllers that need immediate notification of changes. Audit Logs, on the other hand, provide a comprehensive, historical record of every request made to the Kubernetes API server, including who made the request, what they did, and the full request/response body. While Watch is for real-time reactions, Audit Logs are for detailed historical analysis, security forensics, and compliance auditing, offering a "who, what, when" for every interaction with CRs.
4. How do API Gateways, AI Gateways, and LLM Gateways fit into the picture of Custom Resource monitoring?
These gateways are often configured and managed by Custom Resources. For example, an API Gateway might use CRs to define routing rules, rate limits, or authentication policies. An AI Gateway (like APIPark) or LLM Gateway could use CRs to define AI model versions, prompt templates, or access policies for large language models. Monitoring changes in these gateway-related CRs is crucial because such changes directly impact how external traffic is handled, which AI models are exposed, and with what security parameters. Any unexpected or unauthorized change in these CRs could lead to service outages, security breaches, or incorrect AI model behavior.
5. What are some best practices for setting up robust Custom Resource change monitoring?
To set up robust CR change monitoring, consider these best practices: 1. GitOps: Manage all CRs in Git for version control and an inherent audit trail. 2. Layered Approach: Combine multiple monitoring methods (API Watch for operators, Audit Logs for forensics, Metrics/Alerts for proactive detection). 3. Admission Controllers: Use validating and mutating webhooks to prevent invalid or non-compliant CR configurations before they are applied. 4. Idempotent Controllers: Ensure any controller reacting to CR changes can apply the same action multiple times without adverse effects. 5. Expose Metrics: Design your custom resources and controllers to expose Prometheus-compatible metrics, providing insights into their state and performance. 6. RBAC: Apply the principle of least privilege, ensuring monitoring tools and operators only have the necessary permissions. 7. Automated Remediation: Design workflows that can automatically fix or flag issues detected by CR change monitoring, moving towards self-healing systems.
🚀You can securely and efficiently call the OpenAI API on APIPark in just two steps:
Step 1: Deploy the APIPark AI gateway in 5 minutes.
APIPark is developed based on Golang, offering strong product performance and low development and maintenance costs. You can deploy APIPark with a single command line.
curl -sSO https://download.apipark.com/install/quick-start.sh; bash quick-start.sh

In my experience, you can see the successful deployment interface within 5 to 10 minutes. Then, you can log in to APIPark using your account.

Step 2: Call the OpenAI API.