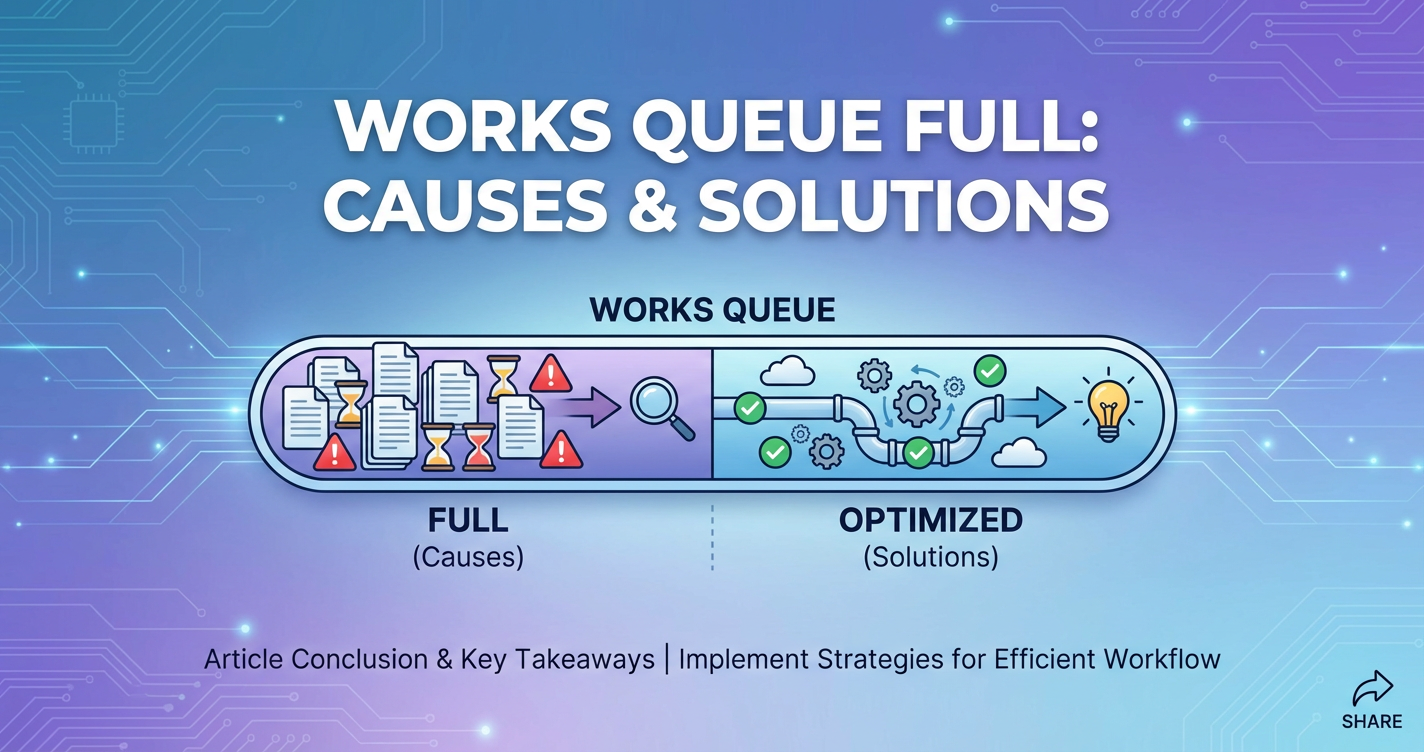
Works Queue Full: Causes & Solutions


In the intricate tapestry of modern digital infrastructure, where microseconds can dictate user experience and system stability, the seemingly innocuous message "Works Queue Full" can strike fear into the hearts of developers and system administrators alike. It's a sentinel, a clear indicator that a system, or a critical component within it, is struggling to keep pace with demand, signaling an impending or active state of overload. Far from being a mere error code, "Works Queue Full" is a symptom, often pointing to deeper architectural challenges, resource constraints, or unexpected traffic surges that require a nuanced understanding and a strategic approach to resolution.
The implications of a full work queue are far-reaching. For end-users, it translates into frustratingly slow response times, failed requests, or even outright service unavailability. For businesses, it means lost revenue, damaged reputation, and a potential cascade of failures across interconnected services. In an era where applications are increasingly distributed, leveraging microservices, cloud computing, and complex API ecosystems, identifying and mitigating the causes of queue saturation is paramount. This comprehensive guide delves into the multifaceted nature of "Works Queue Full," exploring its common manifestations, dissecting its underlying causes across various technological stacks—from web servers and application logic to database systems and advanced API gateways—and, critically, outlining a robust suite of solutions to not only resolve current crises but also to build more resilient, scalable, and performant systems for the future. Understanding this critical indicator is not just about fixing a problem; it's about mastering the art of system design, performance optimization, and proactive infrastructure management.
Part 1: Understanding "Works Queue Full"
To effectively address a "Works Queue Full" scenario, we must first establish a clear understanding of what a "work queue" fundamentally represents in computing and why its capacity is so critical to system operation. At its core, a work queue is a temporary holding area or buffer for tasks, requests, or messages that are waiting to be processed by a system or a specific component. It acts as an intermediary, decoupling the rate at which tasks arrive from the rate at which they can be handled, thereby smoothing out processing fluctuations and preventing direct contention for resources.
Imagine a busy supermarket with multiple checkout counters. Customers arrive continuously, representing incoming tasks or requests. If all checkout counters (processing units) are busy, customers form a line (the work queue). This queue allows the supermarket to manage customer flow, ensuring that even during peak times, customers are eventually served, albeit with a potential wait. The length of this line, or the capacity of the queue, is a crucial design parameter.
In computing systems, work queues manifest in various forms:
- Request Queues: Many web servers, such as Apache or Nginx, maintain internal queues for incoming HTTP requests that are awaiting processing by worker threads or processes. Similarly, application servers often queue requests before passing them to specific business logic handlers.
- Thread Pools: Application runtimes (e.g., Java Virtual Machine, Node.js event loop) often manage a pool of threads or workers. When a new task arrives, if all workers are busy, the task is placed in a queue until a worker becomes available.
- Message Queues: Dedicated message broker systems like Kafka, RabbitMQ, or Amazon SQS utilize queues to facilitate asynchronous communication between different services. Producers send messages to a queue, and consumers retrieve them at their own pace. This is critical for building decoupled, resilient microservices architectures.
- Database Connection Queues: When an application needs to interact with a database, it typically draws a connection from a connection pool. If all connections in the pool are in use, subsequent requests for a connection will be queued until one becomes available.
- I/O Queues: Operating systems manage queues for disk I/O operations, network packets, and other hardware interactions. These ensure that requests to slow peripherals are handled efficiently without blocking the entire system.
The "full" state of a work queue occurs when the incoming rate of tasks consistently exceeds the outgoing rate of processed tasks, and the queue's pre-defined capacity is reached. When this happens, the system faces a critical decision point: it must either reject new incoming requests or attempt to store them beyond its capacity, which typically leads to errors and instability.
The implications of a full queue are immediate and severe:
- Request Rejection: The most common outcome is that new incoming requests are immediately rejected with an error code (e.g., HTTP 503 Service Unavailable, connection refused). This provides a quick signal to the client that the service is overloaded but results in a direct failure for the user.
- Increased Latency: Even before a queue is entirely full, a rapidly growing queue indicates that tasks are waiting longer for processing. This directly translates to increased end-to-end latency for operations, degrading user experience and potentially timing out upstream services.
- Resource Exhaustion: If the system attempts to store more items than its allocated queue capacity, it can lead to memory exhaustion, process crashes, or overall system instability. This is often an unhandled scenario that can bring down the entire application.
- Cascading Failures: In distributed systems, a full queue in one service can lead to timeouts and retries from upstream services, which in turn can overload those services, creating a domino effect that cripples the entire system.
Understanding that a full work queue is not merely an error but a symptom of a system struggling to maintain equilibrium is the first step towards building robust and responsive applications. It signifies a mismatch between demand and capacity, and addressing it requires a deep dive into the underlying causes that prevent the queue from being processed efficiently.
Part 2: Common Causes of "Works Queue Full"
The causes behind a "Works Queue Full" error are diverse, ranging from straightforward resource limitations to subtle application logic flaws and architectural design shortcomings. A comprehensive diagnosis requires looking at the system holistically, considering every layer from the network edge to the deepest backend processes. Identifying the root cause is crucial, as misdiagnosing it can lead to ineffective solutions that merely patch symptoms rather than curing the underlying ailment.
I. Insufficient Resource Allocation
One of the most immediate and often overlooked causes of a full work queue is simply that the system doesn't have enough computational resources to handle the incoming workload. Resources like CPU, memory, disk I/O, and network bandwidth are finite, and exceeding their capacity inevitably slows down task processing, causing queues to build up.
CPU Saturation: When the Central Processing Unit (CPU) is consistently at or near 100% utilization, it means the system is spending all its time executing instructions. New tasks entering the work queue will have to wait longer for CPU time. This can be exacerbated by inefficient code, excessive context switching, or simply too many concurrent processes vying for the CPU. Imagine a single chef trying to prepare a complex meal for too many customers simultaneously; each dish takes longer, and the queue of waiting orders grows indefinitely.
Memory Exhaustion: Applications require memory (RAM) to store data and execute code. If an application consumes too much memory, the operating system might resort to "swapping," moving less frequently used data from RAM to slower disk storage. This dramatic increase in I/O operations due to swapping significantly slows down the entire system, making task processing sluggish and causing queues to swell. Memory leaks, where an application continuously allocates memory without freeing it, are a common culprit here, leading to gradual performance degradation and eventual queue overflow.
Disk I/O Bottlenecks: Many applications frequently read from and write to disk, particularly those interacting with databases, logging systems, or file storage. If the disk subsystem cannot keep up with the rate of read/write requests, these operations become a bottleneck. Tasks waiting for disk access will hold up their respective worker threads or processes, preventing them from picking up new items from the work queue. This is particularly problematic for applications that are "I/O bound," where performance is primarily limited by the speed of I/O operations rather than CPU speed.
Network Bandwidth Limitations: While less common for internal work queues, network bandwidth can become a constraint, especially for systems serving large amounts of data or handling a high volume of small requests. If the network interface or the upstream network path becomes saturated, incoming requests may be delayed or dropped before they even reach the application's work queue, or responses may be slow to leave, keeping processing threads busy longer than necessary. In a distributed system, slow network links between services can also cause downstream services to appear slow, leading to queues building up in upstream components.
II. High Request Volume (Traffic Spikes)
Even a well-provisioned system can buckle under an unexpectedly high volume of requests. Traffic spikes are a common cause of "Works Queue Full" errors, as the rate of incoming tasks suddenly far outstrips the system's normal processing capacity.
Expected vs. Unexpected Traffic: Expected spikes might include seasonal sales events, marketing campaigns, or daily peak usage hours. These can often be planned for with adequate capacity provisioning and auto-scaling mechanisms. However, unexpected spikes, such as a viral social media mention, a sudden news event driving interest, or even a coordinated bot attack, can quickly overwhelm systems that aren't designed for extreme elasticity.
Denial of Service (DoS/DDoS) Attacks: Malicious actors can deliberately flood a system with an overwhelming number of requests, specifically designed to consume resources and fill work queues, rendering the service unavailable to legitimate users. These attacks are particularly insidious because they are often difficult to distinguish from legitimate high traffic without sophisticated detection mechanisms.
Misconfigured Clients: Sometimes, the source of excessive traffic isn't malicious but merely accidental. A bug in a client application or an internal service might cause it to send an inordinate number of requests in a short period, potentially due to an infinite loop, an aggressive retry policy without exponential backoff, or an incorrect API usage pattern. Identifying and rectifying such client-side issues can often quickly alleviate server-side queue pressure.
Regardless of the source, a sudden influx of requests means that the queue fills up faster than tasks can be processed, leading to a backlog and eventual rejection of new requests. This highlights the importance of robust traffic management strategies, including rate limiting and effective load balancing, often implemented at the API Gateway level.
III. Slow Backend Services/Dependencies
In today's interconnected architectures, applications rarely operate in isolation. They frequently depend on other services, databases, and external APIs. If any of these downstream dependencies become slow or unresponsive, they can effectively block the calling service's worker threads or processes, causing its internal work queue to back up.
Database Bottlenecks: Databases are common culprits. Slow SQL queries (e.g., missing indexes, poorly optimized joins, full table scans), database deadlocks, connection pool exhaustion, or an overloaded database server can significantly delay the processing of requests. If an application thread is waiting for a database query to complete, it cannot pick up new tasks from its queue. This can lead to a cascading effect, where the application's queue fills up, even if the application itself is otherwise efficient.
External API Dependencies: Many applications integrate with third-party services for functionalities like payment processing, identity verification, shipping, or content delivery. If these external APIs experience high latency, outages, or rate limits, the calling application will be forced to wait for their responses. This waiting time consumes application threads and resources, eventually leading to internal work queues becoming full. The unreliability of external services is a significant challenge in distributed systems design.
Monolithic Application Performance Issues: In monolithic applications, a single slow component or poorly optimized module can impact the entire system. If a specific business logic function is computationally intensive or performs blocking I/O, it can tie up worker threads, preventing them from processing other, potentially faster, requests, thereby contributing to queue buildup.
Microservices Communication Overhead or Individual Service Slowness: While microservices offer advantages in terms of scalability and fault isolation, they introduce overhead in inter-service communication. If a particular microservice is slow due to its own resource constraints, inefficient logic, or downstream dependencies, it can cause queues to form in the upstream services that depend on it. Moreover, the network latency and serialization/deserialization costs of communicating between many microservices can accumulate, collectively slowing down overall request processing.
IV. Inefficient Application Logic/Code
Even with ample resources and responsive backend services, poorly written or inefficient application code can itself be the primary cause of work queue saturation. The code's inability to process tasks quickly enough, regardless of external factors, will inevitably lead to a backlog.
Long-Running Computations: If certain requests trigger complex, CPU-bound computations that take a long time to complete (e.g., heavy data processing, complex algorithms, image manipulation), they will tie up worker threads for extended periods. If too many such requests arrive concurrently, the available worker pool can quickly become exhausted, and subsequent requests will fill the queue.
Blocking I/O Operations: In many programming models (especially traditional synchronous ones), I/O operations (like reading from a file, making a network request, or querying a database) are "blocking." This means the thread initiating the I/O operation must wait idly until the operation completes before it can proceed. While waiting, that thread cannot process other tasks. In highly concurrent systems, extensive use of blocking I/O without a sufficient thread pool or asynchronous mechanisms is a common recipe for queue congestion.
Memory Leaks and Excessive Garbage Collection: As mentioned under resource allocation, memory leaks can gradually consume available RAM. However, even without outright leaks, inefficient memory usage can lead to excessive "garbage collection" (GC) pauses in managed runtime environments (like Java or .NET). During a full GC cycle, the application's execution can be temporarily halted, causing all processing to stop and allowing incoming requests to quickly fill up work queues.
Poor Algorithm Choices: The choice of algorithms and data structures has a profound impact on performance. Using an inefficient algorithm (e.g., O(n^2) instead of O(n log n)) for operations that handle large datasets can lead to dramatic slowdowns as data volume increases. This means that as the load grows, the time taken to process each request increases non-linearly, quickly overwhelming the system's processing capacity.
V. Misconfigured System Parameters
Many software systems and frameworks come with configurable parameters that dictate how they handle concurrency, connections, and queuing. Incorrectly setting these parameters, particularly under high load conditions, can directly lead to "Works Queue Full" errors.
Thread Pool Sizes: Application servers, web servers, and database connection pools all rely on thread pools to manage concurrent operations. If the thread pool is too small, it can quickly become exhausted during peak load, forcing new tasks into a queue. Conversely, if it's too large, it can lead to excessive context switching overhead, memory consumption, and contention for shared resources, paradoxically slowing down processing. For instance, in Java applications running on Tomcat or Jetty, the maximum number of worker threads is a critical configuration that directly impacts queue behavior.
Queue Capacities: Explicit message queues (like those in RabbitMQ or Kafka) have defined capacities. If producers send messages faster than consumers can process them, and the queue capacity is reached, new messages will be rejected or dropped. Similarly, internal queues within web servers or other components also have configured limits. If these limits are set too low for the expected workload, the "Works Queue Full" error will manifest prematurely.
Database Connection Pool Limits: Database connection pools are designed to manage and reuse database connections, reducing the overhead of establishing new connections for every request. If the maximum number of connections in the pool is too low, requests needing a database connection will be queued. If the application holds connections for too long, or if the database itself is slow to release connections, the queue will inevitably fill.
Timeout Settings: While not a direct cause of a full queue, improperly configured timeouts can exacerbate the problem. If a service has very short timeouts when calling a slow backend, it might release its worker thread quickly (which is good), but the upstream caller might retry aggressively, leading to a flood of new requests back into the queue. Conversely, if timeouts are too long, worker threads can be held up indefinitely waiting for unresponsive dependencies, making them unavailable for other tasks and contributing to queue buildup.
VI. Unmanaged Concurrency and Synchronization Issues
Even beyond simple resource limits and code efficiency, the way concurrent operations are managed within an application can contribute significantly to queue saturation.
Excessive Concurrency: While concurrency is essential for performance, too many concurrent threads or processes can be detrimental. Each thread consumes memory and CPU resources (for context switching). Beyond an optimal point, adding more threads can lead to diminishing returns or even performance degradation due to increased contention for shared resources and cache misses. This can overwhelm the system's ability to process tasks, leading to queue growth.
Contention for Shared Resources: In multithreaded applications, access to shared data structures, files, or other resources must often be synchronized using locks, mutexes, or semaphores to prevent data corruption. If these synchronization mechanisms are poorly implemented or frequently contended, threads will spend significant time waiting for locks to be released. This waiting time effectively removes threads from actively processing tasks, slowing down throughput and causing queues to build up.
Deadlocks and Livelocks: These are more severe synchronization issues. A deadlock occurs when two or more threads are perpetually blocked, each waiting for the other to release a resource. A livelock is similar, where threads are constantly changing state in response to each other without making any progress. Both scenarios can effectively remove worker threads from the processing pool, leading to a rapid filling of the work queue as new requests arrive but no workers are available to pick them up. These are often difficult to diagnose, as the system might appear to be "doing something" but is actually stuck.
Identifying the precise cause of a "Works Queue Full" error often requires a systematic approach, combining real-time monitoring, historical data analysis, and sometimes, deep code inspection and load testing. It's rarely a single factor but often a combination of several, creating a complex interaction that pushes the system past its breaking point.
Part 3: Specific Contexts & "Works Queue Full"
The manifestation and resolution of "Works Queue Full" errors can vary significantly depending on the specific component or layer of the infrastructure where it occurs. Understanding these nuances is key to effective troubleshooting and architectural design.
A. Web Servers (Apache, Nginx)
Web servers are the frontline of many applications, responsible for accepting incoming HTTP requests and forwarding them to application logic. They are designed for high concurrency but have finite capacities.
Worker Processes/Threads and Connection Limits: Both Apache and Nginx manage concurrent requests using worker processes or threads. * Apache uses Multi-Processing Modules (MPMs) like mod_prefork, mod_worker, or mod_event. For instance, mod_prefork creates child processes, each handling one request, while mod_worker and mod_event use threads within processes. Parameters like MaxRequestWorkers (Apache 2.4+ equivalent to MaxClients) directly control the maximum number of concurrent requests Apache can handle. If this limit is reached, subsequent requests are placed in the operating system's listen backlog queue. If that queue also fills, new connections will be refused, leading to "Works Queue Full" from the client's perspective (connection refused or timeout). * Nginx employs an event-driven, non-blocking architecture, typically running a master process and several worker processes. Each worker can handle thousands of concurrent connections using asynchronous I/O. The worker_connections directive specifies the maximum number of connections a worker process can handle. While Nginx is highly efficient, if backend application servers are slow or non-responsive, Nginx worker connections can remain tied up waiting for responses. Even with its non-blocking nature, an overwhelming number of concurrent requests, combined with slow backends, can exhaust its capacity or cause its internal queues for proxying to fill.
Impact of Slow Backend Application Servers: A common scenario is when the web server itself isn't the bottleneck, but the application server it proxies requests to is slow. Nginx workers, for example, might be waiting indefinitely for a response from an overloaded PHP-FPM, Tomcat, or Node.js backend. While waiting, these workers cannot serve new requests, effectively reducing the available capacity and indirectly leading to the web server's request queue being saturated or clients experiencing timeouts. The web server's queue is full because its "work" (waiting for the backend) is stalled.
B. Application Servers (Java EE, Node.js, Python frameworks)
Application servers host the core business logic and often manage their own internal queues and thread pools.
Thread Pools: Most traditional application servers (like Apache Tomcat, Jetty, WildFly for Java applications; Gunicorn/uWSGI for Python; Puma for Ruby) utilize a fixed-size thread pool to process incoming requests. When a request arrives, a thread from the pool is assigned to handle it. If all threads are busy, new requests are placed in an internal queue. If this queue reaches its max-queue-size (or similar configuration), subsequent requests will be rejected, resulting in a "Works Queue Full" error at the application level. This often indicates that individual requests are taking too long to process, or the thread pool is simply too small for the concurrent load.
Event Loops: Node.js, with its single-threaded, non-blocking event loop model, handles concurrency differently. While it doesn't have a traditional "thread pool" in the same sense, a single long-running, CPU-bound operation (e.g., synchronous heavy computation) can block the event loop entirely. This means no other incoming requests or pending I/O callbacks can be processed until the blocking operation completes. The "queue" here isn't a explicit thread queue but the event queue itself, where events stack up, leading to extremely high latency and apparent unresponsiveness.
Database Connection Pooling: Applications frequently interact with databases. To avoid the overhead of establishing a new connection for every request, they use connection pools (e.g., HikariCP, C3P0 in Java). If the maximum number of connections in the pool is too low, or if application code holds onto connections for too long, requests needing database access will be queued by the connection pool manager. If this queue fills, the application will report a "connection pool full" or similar error, which effectively contributes to the main application's work queue filling up as threads wait for resources.
C. Database Systems
Databases are often critical bottlenecks, and they have their own internal queuing mechanisms.
Connection Limits: Databases themselves have a maximum number of concurrent connections they can handle (e.g., max_connections in PostgreSQL/MySQL). If applications attempt to open more connections than allowed, these attempts will be queued by the database server. If the database's own connection queue fills, new connection requests will be rejected, manifesting as "Works Queue Full" from the application's perspective, or more specifically, "too many connections."
Query Queues and Transaction Queues: While not always explicitly exposed as user-configurable queues, databases process queries and transactions internally in a queued manner. Long-running queries, complex transactions, or contention for locks on tables/rows can cause subsequent queries to wait. This internal waiting, while not typically resulting in a "Works Queue Full" error from the database itself for individual queries, can cause the application's connection pool to exhaust and its worker threads to block, ultimately leading to the application's work queue becoming full.
D. API Gateway Context
An API Gateway is a crucial component in modern microservices architectures. It acts as a single entry point for all API requests, providing functionalities like routing, load balancing, authentication, rate limiting, monitoring, and caching. Because it's a central point of contact, a gateway is particularly susceptible to "Works Queue Full" scenarios and plays a critical role in mitigating them.
How "Works Queue Full" Manifests at an API Gateway: * Gateway's Internal Queues: Like any server, an API Gateway itself has internal queues for incoming requests. If the gateway is overwhelmed by traffic (e.g., a massive surge, a DDoS attack), or if its own processing of requests (authentication, transformation, logging) becomes slow, its internal queues can fill up. This would lead to the gateway rejecting new requests directly. * Rate Limiting and Throttling: A primary function of an API Gateway is to enforce rate limits and throttling policies. If an API Gateway detects that a client or overall traffic exceeds configured limits, it will queue or reject requests. While this is intentional to protect downstream services, if the queue for "limited" requests fills up, it still manifests as a rejection for the client, conceptually a "Works Queue Full" due to policy. * Impact of Slow Upstream Services: The most common scenario for a gateway is when the backend microservices it routes to are slow or unresponsive. The gateway's worker threads or processes become tied up waiting for responses from these upstream services. Even if the gateway itself is performant, if its workers are all blocked waiting, its capacity to handle new incoming requests effectively diminishes, causing its internal request queue to grow and eventually fill. This is a classic example of a cascading failure, where the gateway becomes a bottleneck due to problems elsewhere in the system.
Specific Considerations for LLM Gateways: The rise of Artificial Intelligence (AI) and Large Language Models (LLMs) introduces unique challenges for gateway architectures. An LLM Gateway is a specialized API Gateway designed to manage and optimize access to LLM inference services. * High Computational Demands: LLM inference is notoriously computationally intensive, often requiring powerful GPUs and significant memory. A single inference request can take hundreds of milliseconds or even seconds, tying up processing resources for much longer than typical REST API calls. * Batching Requests: To improve throughput, LLM Gateways often implement batching, where multiple small inference requests are grouped and sent to the LLM as a single large request. While efficient for the LLM, if the batching logic is overwhelmed or if there aren't enough batched requests to fill a GPU, individual requests might sit in a queue waiting to be part of a batch. * GPU Resource Contention: GPU resources are expensive and often shared. An LLM Gateway must efficiently manage access to these limited resources. If all GPUs are busy processing existing inferences, new requests will queue up. * Model Loading Times: Loading an LLM model into GPU memory can take significant time. If an LLM Gateway dynamically loads models or manages multiple models, the latency introduced by loading can cause a backlog.
For organizations managing complex AI ecosystems, an advanced LLM Gateway like ApiPark becomes indispensable. APIPark is designed to streamline the integration and management of diverse AI models, offering features that directly address the 'Works Queue Full' challenge in AI inference scenarios. Its capabilities, such as quick integration of 100+ AI models, unified API format for AI invocation, and prompt encapsulation into REST API, simplify the use of LLMs. Crucially, APIPark's high-performance architecture, rivaling Nginx with over 20,000 TPS on modest hardware and supporting cluster deployment, means it can handle large-scale AI traffic efficiently. This robust performance and intelligent routing minimize the chances of the gateway itself becoming a bottleneck, even under intense LLM workloads, allowing requests to flow smoothly to the AI models. Its end-to-end API lifecycle management, including traffic forwarding and load balancing, further ensures that API calls are optimally managed to prevent queue saturation. Detailed API call logging and powerful data analysis features within APIPark also provide invaluable insights for proactive monitoring and capacity planning, helping teams identify potential bottlenecks before they lead to "Works Queue Full" errors.
E. Message Queues (Kafka, RabbitMQ)
Dedicated message queuing systems are designed to handle massive throughput and provide asynchronous communication. However, they too can experience "full queue" scenarios.
Producer Queues: While message brokers are typically very resilient, if producers generate messages at a much higher rate than the broker can ingest them (e.g., due to disk I/O limits on the broker, network saturation, or broker internal processing bottlenecks), messages might queue up in the producer's buffer. If this buffer fills, the producer client library might block or drop messages, conceptually a "Works Queue Full" on the producer side.
Consumer Lag and Queue Build-up: The more common scenario is when consumers cannot keep up with the rate of messages being produced. Messages accumulate in the broker's queues. If a queue's retention policy is time-based, older messages might be dropped. If it's size-based and the disk fills up (e.g., Kafka topic partitions), the broker might stop accepting new messages or even crash, leading to a "Works Queue Full" for producers. Consumer lag is a critical metric here, indicating the depth of the backlog. Persistent queue systems like RabbitMQ will fill up disk space, eventually halting message ingestion.
Understanding where the "Works Queue Full" error originates—whether it's at the web server, application layer, database, or particularly within an API Gateway or specialized LLM Gateway—is the foundational step. Each context requires a slightly different diagnostic approach and a tailored set of solutions, which we will explore next.
APIPark is a high-performance AI gateway that allows you to securely access the most comprehensive LLM APIs globally on the APIPark platform, including OpenAI, Anthropic, Mistral, Llama2, Google Gemini, and more.Try APIPark now! 👇👇👇
Part 4: Comprehensive Solutions for "Works Queue Full"
Resolving and preventing "Works Queue Full" errors requires a multi-faceted approach, encompassing monitoring, scaling, optimization, and architectural adjustments. There's no single magic bullet; instead, a combination of strategies tailored to the identified root causes is usually necessary.
I. Monitoring and Alerting
The first and most critical step in addressing any performance issue, including full queues, is robust monitoring and alerting. You cannot fix what you cannot see. Proactive monitoring helps detect problems early, often before they impact users, and provides the data needed for effective diagnosis.
Key Metrics to Track: * Queue Depth/Size: Directly measure the number of items currently in the work queue. This is the most direct indicator of impending saturation. High or rapidly increasing queue depth is a red flag. * Request Latency: Monitor the time it takes for requests to be processed, both at the entry point (e.g., API Gateway) and within individual services. Increased latency often correlates with growing queue depth. * CPU Utilization: Track overall CPU usage across all instances. Sustained high CPU (above 80-90%) indicates a CPU bottleneck. * Memory Usage: Monitor RAM consumption and swap space utilization. High memory usage or active swapping points to memory pressure. * Network I/O: Track inbound and outbound network throughput and packet errors. Identify if network capacity is being exhausted. * Disk I/O: Monitor disk read/write operations per second (IOPS), throughput, and average I/O wait times. High wait times indicate disk bottlenecks. * Error Rates: Observe the frequency of errors (e.g., HTTP 5xx responses, connection refused errors). A sudden spike in errors often accompanies full queues. * Active Connections/Threads: Monitor the number of active connections to databases, external services, or the number of active threads in application pools. If these approach their maximum limits, it suggests resource contention. * Garbage Collection (GC) Pauses: For managed runtimes (Java, .NET), track GC frequency and duration. Long or frequent GC pauses can significantly impact throughput and contribute to queue buildup.
Tools for Monitoring: * Infrastructure Monitoring: Prometheus, Grafana, Datadog, New Relic, Zabbix, Nagios. * Application Performance Monitoring (APM): Dynatrace, AppDynamics, Jaeger (for distributed tracing). * Log Management: ELK Stack (Elasticsearch, Logstash, Kibana), Splunk, DataDog Logs. * Cloud-Native Tools: AWS CloudWatch, Google Cloud Monitoring, Azure Monitor.
Setting Up Proactive Alerts: Configure alerts on key metrics that indicate a problem before the queue is completely full. For example, an alert if queue depth exceeds 70% of capacity for a sustained period, or if CPU utilization is above 85% for more than 5 minutes. Alerts should be routed to the appropriate teams (on-call engineers, SREs) with clear context to facilitate rapid response. APIPark, for example, offers detailed API call logging and powerful data analysis, which are instrumental in tracking these metrics and identifying trends that might indicate future queue saturation.
Here's a sample table outlining key metrics and their relevance:
| Metric Category | Specific Metric | Typical Thresholds for Alerting (Examples) | Relevance to "Works Queue Full" Cause |
|---|---|---|---|
| Queue Depth | HTTP Request Queue Length | >70% of max capacity | Direct indicator of overload |
| Message Queue Lag (messages) | >X messages for Y minutes | Consumer inability to keep up | |
| Thread Pool Queue Size | >50% of max size | Application logic or backend slowness | |
| Latency | Request Latency (P99) | >2x baseline, or >500ms | Slow processing or backend dependencies |
| Resource Usage | CPU Utilization | >85% for 5 minutes | CPU bottleneck, inefficient code |
| Memory Usage | >80% total, or high swap usage | Memory leaks, insufficient RAM | |
| Disk I/O Wait Time | >10ms average | Disk bottleneck | |
| Network Bandwidth Usage | >80% of link capacity | Network saturation | |
| System/App Health | Error Rate (HTTP 5xx) | >1% of total requests | System under stress, request rejection |
| Database Connections | >90% of max connections | Database connection exhaustion | |
| GC Pause Duration | >1 second (JVM specific) | Excessive garbage collection |
II. Resource Scaling (Horizontal & Vertical)
Once monitoring identifies a consistent resource bottleneck, scaling is often the most direct solution.
Vertical Scaling (Scaling Up): This involves upgrading the resources of a single server instance, such as adding more CPU cores, increasing RAM, or upgrading to faster storage (e.g., NVMe SSDs). Vertical scaling is simpler to implement initially but has physical limits and can introduce a single point of failure. It's effective for applications that are difficult to horizontally scale or for immediately alleviating bottlenecks in a single component.
Horizontal Scaling (Scaling Out): This involves adding more identical instances of an application or service and distributing the load across them using a load balancer. Horizontal scaling is generally preferred for its elasticity, resilience (removing single points of failure), and cost-effectiveness in cloud environments. It allows the system to handle increased load by simply adding more capacity.
- Load Balancing: A crucial component for horizontal scaling. A load balancer (e.g., Nginx, HAProxy, AWS ELB, Azure Load Balancer, Google Cloud Load Balancer) distributes incoming requests across multiple healthy instances of a service. This prevents any single instance from becoming overwhelmed and ensures efficient utilization of resources. Many API Gateways, including APIPark, offer integrated load balancing capabilities to effectively manage traffic across multiple backend services.
- Autoscaling: In cloud environments, autoscaling groups automatically adjust the number of instances based on demand (e.g., CPU utilization, queue depth, request latency). This ensures that capacity dynamically matches workload, preventing "Works Queue Full" during spikes and optimizing costs during low periods.
III. Optimizing Backend Services
Addressing the root cause of slow processing in backend services is paramount.
Database Optimization: * Indexing: Ensure appropriate indexes are created on frequently queried columns to speed up data retrieval. * Query Tuning: Analyze and optimize slow SQL queries. This might involve rewriting queries, breaking down complex joins, or using materialized views. * Connection Pooling: Configure database connection pools correctly (max connections, min connections, idle timeouts) to balance resource usage and connection overhead. * Caching: Implement caching layers (e.g., Redis, Memcached, application-level caches) for frequently accessed, immutable, or slow-to-generate data. This reduces the load on the database significantly. * Database Scaling: For very high loads, consider database replication (read replicas), sharding, or moving to NoSQL databases for specific use cases.
Application Code Optimization: * Asynchronous Programming: Where possible, use non-blocking I/O and asynchronous programming patterns (e.g., async/await in Node.js/Python, CompletableFuture in Java) to ensure worker threads are not idly waiting for I/O operations. This allows a smaller number of threads to handle a much higher concurrency. * Efficient Algorithms and Data Structures: Review critical code paths for algorithmic complexity. Replace inefficient algorithms (e.g., O(n^2) or O(n^3)) with more performant ones (e.g., O(n log n) or O(n)) for large datasets. * Reducing Computational Complexity: Identify and optimize CPU-bound tasks. Can computations be pre-computed, batched, or offloaded to a dedicated worker service? * Memory Management: Address memory leaks. Tune JVM or other runtime parameters (e.g., heap size, garbage collector type) to minimize GC pauses. * Microservices Architecture Considerations: In a microservices environment, implement patterns like Circuit Breakers (to prevent cascading failures to slow services), Bulkheads (to isolate resources and prevent one service's failure from affecting others), and Retries with Exponential Backoff (to gracefully handle transient errors without overwhelming the backend).
External Dependency Management: * Caching External Responses: Cache responses from external APIs to reduce the frequency of calls. * Asynchronous Calls: If possible, make calls to external services asynchronously. * Timeouts and Retries: Implement sensible timeouts for external calls and use intelligent retry mechanisms (e.g., exponential backoff, jitter) to avoid overwhelming a struggling external service. * Fallback Mechanisms: Design fallback logic for when external services are unavailable or slow, perhaps serving cached data or a degraded experience.
IV. Traffic Management & Control
Effective traffic management is critical, especially at the API Gateway layer, to protect backend services from being overwhelmed.
Rate Limiting: This technique restricts the number of requests a user or client can make to an API within a given time window. If the limit is exceeded, subsequent requests are rejected. * Implementation: Can be done at the API Gateway (e.g., Nginx, Kong, Apigee, APIPark), web server, or application level. Algorithms like token bucket or leaky bucket are commonly used. * Benefit: Prevents abuse, ensures fair usage, and protects backend services from being flooded during unexpected spikes.
Throttling: Similar to rate limiting, but often involves delaying requests rather than outright rejecting them, or gradually reducing the processing rate to match the system's capacity. This helps to smooth out traffic spikes.
Load Balancing: As discussed, distributing incoming requests across multiple healthy service instances is fundamental for horizontal scaling and preventing a single point of failure from becoming a bottleneck. An API Gateway is an ideal place to implement intelligent load balancing.
Circuit Breakers: A design pattern borrowed from electrical engineering. When a service detects that a downstream dependency is failing or slow (e.g., repeated timeouts), it "opens" the circuit, meaning it stops sending requests to that dependency for a period, instead failing fast or serving a fallback. This prevents cascading failures and allows the failing service time to recover. Once a timeout period passes, the circuit goes into a "half-open" state, allowing a few test requests to see if the service has recovered.
Queue-based Load Leveling: Use message queues (e.g., Kafka, RabbitMQ) to decouple producers from consumers. When a service receives high traffic, instead of processing requests synchronously, it can quickly place them into a message queue. Consumers can then process these messages at their own pace, even if it's slower than the production rate. This helps to absorb traffic spikes and prevents direct overload of processing services. This is particularly effective for background tasks or non-real-time operations.
Admission Control: Implement mechanisms to restrict the total number of concurrent requests allowed into a system. If the number exceeds a predefined threshold, new requests are either queued internally or rejected. This provides a hard limit to protect the system from extreme overload.
V. System Configuration Tuning
Optimizing system-level and application-level configurations can have a profound impact on performance.
- Thread Pool Sizes: Carefully tune the
max-threads,min-threads, and queue capacities of application server thread pools (e.g., Tomcat, Jetty, Gunicorn). The optimal size often depends on the nature of the workload (CPU-bound vs. I/O-bound) and available resources. Too few threads cause queues; too many cause overhead. - JVM Tuning: For Java applications, configure JVM parameters like heap size (
-Xmx,-Xms), garbage collector (-XX:+UseG1GC,-XX:+UseParallelGC), and other settings to minimize GC pauses and optimize memory usage. - OS Level Parameters: Adjust operating system parameters such as file descriptor limits (
ulimit -n), TCP backlog queue size (net.core.somaxconn), andsysctlsettings to accommodate high concurrency and network traffic. - Database Configuration: Fine-tune database parameters like
max_connections, buffer sizes (e.g.,shared_buffersin PostgreSQL,innodb_buffer_pool_sizein MySQL), and statement timeouts.
VI. Architectural Redesign Considerations
For persistent or severe "Works Queue Full" problems, particularly those stemming from fundamental design limitations, a more significant architectural redesign might be necessary.
- Monolithic to Microservices (Carefully): While not a panacea, breaking down a large monolithic application into smaller, independently deployable microservices can allow for more granular scaling, better fault isolation, and specialized teams. Each microservice can be scaled and optimized independently, potentially preventing one slow component from bringing down the entire system. However, this also introduces complexity (inter-service communication, distributed tracing, data consistency) that must be managed.
- Event-Driven Architectures: Shifting to an event-driven model, often leveraging message queues or event streams, can significantly decouple services. Instead of direct synchronous calls, services publish events, and other services react to them. This inherently promotes asynchronous processing and resilience to individual service failures.
- Serverless Functions: For burstable, intermittent, or highly variable workloads, serverless functions (AWS Lambda, Azure Functions, Google Cloud Functions) can be highly effective. They automatically scale to handle demand without explicit server management, potentially preventing queue buildup by providing near-instantaneous scaling.
- Robust Retry Mechanisms: Implement thoughtful retry logic with exponential backoff and jitter in client applications and upstream services when calling potentially unstable or overloaded downstream services. This prevents clients from repeatedly hammering a struggling service, allowing it time to recover.
VII. Capacity Planning
Proactive capacity planning is essential for preventing "Works Queue Full" errors before they occur.
- Predicting Future Load: Analyze historical traffic patterns and forecast future growth based on business objectives, marketing campaigns, and seasonal trends.
- Stress Testing and Load Testing: Regularly perform stress tests and load tests on your applications and infrastructure to identify bottlenecks and determine the system's breaking point under various load conditions. This helps validate the effectiveness of scaling strategies and configuration tuning.
- Regular Performance Reviews: Continuously review monitoring data, conduct post-mortems for any incidents, and proactively identify areas for optimization. Performance should be an ongoing concern, not just an afterthought.
By adopting a comprehensive strategy that combines continuous monitoring, intelligent scaling, deep optimization, and thoughtful architectural design, organizations can effectively mitigate "Works Queue Full" errors, ensuring their systems remain performant, resilient, and responsive even under extreme loads.
Part 5: Preventing Future Occurrences
While resolving an active "Works Queue Full" crisis is paramount, true system reliability lies in preventing its recurrence. A forward-looking approach integrates lessons learned from past incidents into continuous improvement cycles, making the infrastructure inherently more resilient.
Proactive Monitoring and Predictive Analytics: Moving beyond reactive alerting, investing in predictive analytics can anticipate potential queue saturation before it happens. By analyzing trends in queue depth, resource utilization, and traffic patterns, systems can trigger proactive scaling actions or alert operations teams to impending bottlenecks. This involves setting up sophisticated dashboards that visualize long-term trends, allowing engineers to identify gradual performance degradation or consistent high-water marks that signal a need for more permanent capacity adjustments. For instance, if an API Gateway like APIPark consistently reports high average latency or increasing queue depths for specific AI models, predictive analytics can suggest pre-scaling GPU instances or optimizing model serving parameters before actual service degradation occurs.
Regular Performance Reviews and Audits: Treat performance as an ongoing discipline, not a one-off project. Schedule regular performance audits, especially before major releases or anticipated traffic surges. These audits should involve: * Code Reviews focused on Performance: Identify potential N+1 queries, inefficient loops, or blocking I/O operations in new code. * Configuration Reviews: Ensure system and application parameters (thread pool sizes, timeouts, connection limits) are still appropriate for the current and projected load. * Infrastructure Health Checks: Verify that network infrastructure, storage systems, and virtualization layers are performing optimally. * Dependency Audits: Regularly review the performance and reliability of third-party APIs and internal microservices.
Infrastructure-as-Code (IaC) and Automation: Automate the deployment and configuration of your infrastructure using tools like Terraform, Ansible, or Kubernetes. IaC ensures consistency across environments, reducing the risk of misconfigurations that can lead to bottlenecks. Automated deployment pipelines (CI/CD) with integrated performance testing stages can catch performance regressions early. This also facilitates rapid scaling and recovery during incidents, as new resources can be provisioned and configured without manual intervention, which is crucial when trying to mitigate a "Works Queue Full" scenario quickly.
Chaos Engineering: Deliberately inject faults and stressors into your system to test its resilience. By simulating scenarios like network latency, service failures, or resource exhaustion (e.g., artificially reducing thread pool sizes, slowing down specific microservices), you can discover weaknesses in your system's queuing mechanisms, fallback strategies, and scaling capabilities before they manifest in production during real-world incidents. This practice helps validate the effectiveness of circuit breakers, autoscaling, and retry mechanisms. Understanding how your API Gateway or LLM Gateway responds to simulated upstream failures is invaluable for building true resilience.
Post-Incident Analysis (Post-Mortems): Every incident, especially those involving "Works Queue Full" errors, should trigger a thorough post-mortem. This isn't about blame but about learning. Key questions to address include: * What was the exact root cause? * How could monitoring have detected it earlier? * What manual interventions were made, and how can they be automated? * What architectural or code changes are needed to prevent recurrence? * What was the impact on users and the business? Documenting these findings and implementing corrective actions derived from them ensures continuous improvement and prevents repeating the same mistakes.
By embedding these preventive measures into the development and operations lifecycle, organizations can cultivate a culture of reliability and performance. This proactive stance transforms the "Works Queue Full" error from a system-threatening crisis into a rare and manageable anomaly, ultimately leading to more stable, efficient, and user-friendly digital experiences.
Conclusion
The "Works Queue Full" error is more than just a fleeting message; it is a critical symptom revealing underlying pressures within complex digital systems. From insufficient resource allocation and sudden traffic spikes to inefficient application logic and slow backend dependencies, the causes are multifaceted, demanding a comprehensive and systematic approach to diagnosis and resolution. Whether manifesting in traditional web servers, sophisticated application architectures, database systems, or cutting-edge API Gateways—especially specialized LLM Gateways grappling with intense computational demands—understanding the context is paramount.
Addressing this challenge effectively requires a blend of robust monitoring to identify bottlenecks, strategic scaling (both vertical and horizontal) to meet demand, meticulous optimization of backend services and application code, and intelligent traffic management at every layer, particularly at the gateway level where policies like rate limiting and load balancing are enforced. Solutions range from fine-tuning system configurations and leveraging asynchronous programming to considering architectural redesigns that embrace event-driven patterns or serverless computing for enhanced elasticity. Products like ApiPark, with its high-performance architecture and specialized features for AI model management, exemplify how purpose-built LLM Gateways can significantly mitigate queuing issues in the demanding world of artificial intelligence inference.
Ultimately, preventing the recurrence of "Works Queue Full" necessitates a proactive stance. This involves continuous performance reviews, rigorous capacity planning, the adoption of Infrastructure-as-Code for consistency, and the practice of chaos engineering to validate system resilience. By fostering a culture of continuous learning and improvement, organizations can transform these critical signals from potential outages into opportunities for building more robust, scalable, and future-proof systems, ensuring a seamless experience for end-users and uninterrupted service delivery for businesses. The journey to system mastery is ongoing, and a deep understanding of queue dynamics is a fundamental step on that path.
5 Frequently Asked Questions (FAQ)
1. What does "Works Queue Full" mean in a technical context? "Works Queue Full" signifies that a specific component or system has exhausted its capacity to temporarily hold incoming tasks, requests, or messages that are awaiting processing. This queue, or buffer, has reached its predefined limit, and any new items attempting to enter it will likely be rejected, dropped, or cause an error. It's a critical indicator that the rate of incoming work is consistently exceeding the rate at which the system can process it, leading to a backlog and potential service degradation or unavailability. This often points to resource contention, inefficient processing, or an overwhelming surge in demand.
2. How does an API Gateway contribute to or mitigate "Works Queue Full" errors? An API Gateway can both contribute to and mitigate "Works Queue Full" errors. It contributes if the gateway itself becomes a bottleneck due to high traffic, slow internal processing (e.g., complex authentication or data transformation), or if its worker threads are tied up waiting for slow backend services. However, an API Gateway is primarily designed to mitigate these errors by acting as a traffic management hub. It provides crucial features like rate limiting, throttling, load balancing, and circuit breaking, which protect downstream backend services from being overwhelmed. By intelligently managing and distributing incoming requests, an API Gateway helps absorb spikes, prioritize critical traffic, and prevent cascading failures that could lead to full queues across the system.
3. What are the unique "Works Queue Full" challenges for an LLM Gateway? An LLM Gateway faces unique "Works Queue Full" challenges due to the computationally intensive nature of Large Language Model (LLM) inference. LLM inference requests often require significant GPU resources and can take much longer to process than typical API calls, potentially tying up gateway resources for extended periods. Challenges include managing GPU resource contention, efficiently handling request batching (where requests might queue awaiting enough peers for a batch), and dealing with potentially long model loading times. An efficient LLM Gateway must be optimized for high-performance computing environments to ensure smooth processing and prevent queues from building up as requests wait for model inference.
4. What are the immediate steps to take when a "Works Queue Full" alert fires? When a "Works Queue Full" alert fires, immediate steps typically involve: 1. Verify the Scope: Determine which specific service or component is reporting the full queue and its impact on users. 2. Check Key Metrics: Quickly review CPU, memory, disk I/O, network usage, and latency for the affected component and its immediate dependencies. Look for sudden spikes or sustained high utilization. 3. Inspect Logs: Check logs for any recent errors, exceptions, or warnings that could indicate a new issue or a performance regression. 4. Scaling (if applicable): If the issue is due to a sudden traffic spike and the infrastructure supports it, initiate horizontal scaling (add more instances) for the affected service. 5. Traffic Control: If possible, implement temporary rate limiting or admission control at the API Gateway to shed excess load and allow the system to recover. 6. Identify Bottleneck: Use monitoring tools to pinpoint the slowest part of the request path (e.g., a slow database query, an unresponsive external API, or inefficient application code).
5. How can I prevent "Works Queue Full" errors from happening in the first place? Preventing "Works Queue Full" errors requires a proactive and holistic strategy: 1. Robust Monitoring & Alerting: Continuously monitor key performance metrics (queue depth, latency, resource usage) and configure early warning alerts. 2. Capacity Planning: Regularly perform load testing, stress testing, and forecast future demand to ensure adequate resource provisioning. 3. Optimize Code & Architecture: Implement efficient algorithms, asynchronous programming, database indexing, caching, and consider resilient architectural patterns like microservices, circuit breakers, and event-driven designs. 4. Traffic Management: Utilize an API Gateway for effective rate limiting, throttling, and load balancing to protect backend services. 5. Configuration Tuning: Properly configure system and application parameters, such as thread pool sizes, connection limits, and JVM settings. 6. Chaos Engineering: Regularly test the system's resilience by intentionally injecting faults to uncover weaknesses before they cause real-world incidents. 7. Post-Mortem Learning: Analyze every incident thoroughly to identify root causes and implement preventive measures to avoid recurrence.
🚀You can securely and efficiently call the OpenAI API on APIPark in just two steps:
Step 1: Deploy the APIPark AI gateway in 5 minutes.
APIPark is developed based on Golang, offering strong product performance and low development and maintenance costs. You can deploy APIPark with a single command line.
curl -sSO https://download.apipark.com/install/quick-start.sh; bash quick-start.sh

In my experience, you can see the successful deployment interface within 5 to 10 minutes. Then, you can log in to APIPark using your account.

Step 2: Call the OpenAI API.