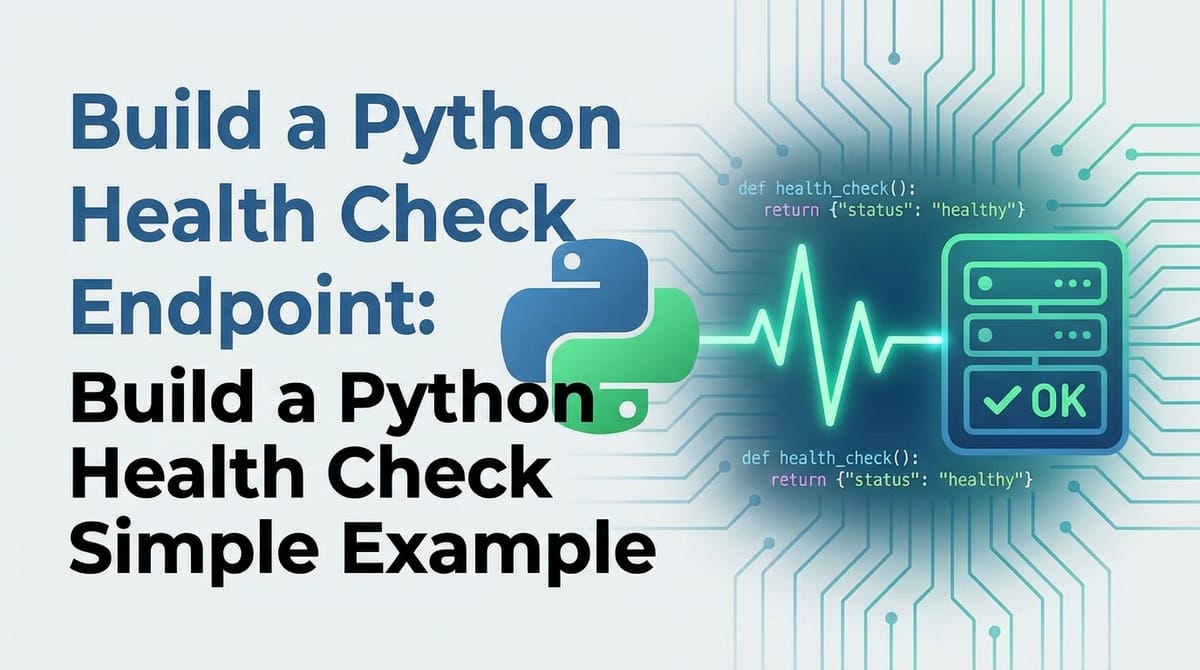
Build a Python Health Check Endpoint: Simple Example


In the intricate tapestry of modern software architecture, where applications are increasingly decomposed into myriad microservices, deployed across dynamic cloud environments, the assurance of continuous operation stands paramount. The resilience and reliability of these distributed systems are not merely a luxury but a fundamental requirement for delivering a seamless user experience. At the heart of maintaining this operational integrity lies a seemingly humble yet profoundly critical component: the health check endpoint. This article embarks on a comprehensive journey to demystify health check endpoints, focusing on their practical implementation within Python applications, demonstrating how even a "simple example" can underpin a robust and highly available service. We will explore the nuances of designing and integrating these endpoints, not just as isolated features, but as integral parts of a larger ecosystem involving load balancers, container orchestrators, and sophisticated API gateways.
The proliferation of application programming interfaces (APIs) as the primary means of communication between services has necessitated rigorous methods for monitoring their availability and performance. Whether a service is exposing a REST API for customer data, an internal API for inventory management, or a specialized API for AI inference, its operational status directly impacts the functionality of dependent systems. A health check endpoint serves as a diagnostic window into the current state of a service, offering a standardized mechanism for external systems to ascertain if the application is alive, responsive, and ready to handle requests. Without these critical probes, issues might linger undetected, leading to cascading failures, service degradation, and ultimately, a compromised user experience. This deep dive will equip developers with the knowledge and tools to craft effective health checks in Python, ensuring their services contribute to a resilient and dependable distributed landscape.
Understanding the Imperative of Health Checks in Modern Systems
To truly grasp the significance of a health check endpoint, one must first appreciate the landscape of contemporary software deployment. We are far removed from monolithic applications running on single servers. Today, systems are composed of dozens, hundreds, or even thousands of independent services, each potentially deployed in multiple instances, scaled elastically, and orchestrated across a cluster of machines. In such an environment, the failure of a single instance or a single dependency can have widespread repercussions if not managed effectively. This is where health checks become indispensable.
What is a Health Check Endpoint?
At its core, a health check endpoint is a dedicated Uniform Resource Locator (URL) within your application that, when queried, returns information about the application's operational status. It's typically a lightweight API endpoint, often located at /health or /ready, designed to respond quickly without consuming significant resources. The response to such a query is not intended for human consumption in the same way a typical user-facing API response might be; instead, it's designed to be easily machine-readable, usually returning an HTTP status code (like 200 OK for healthy, or 500 Internal Server Error for unhealthy) and sometimes a JSON payload with more granular details.
The elegance of a health check lies in its simplicity and its profound utility. It acts as a contract: "If you ping me here, I will tell you how I'm doing." This contract is critical for various infrastructure components that rely on knowing the state of your application instances to make intelligent decisions about traffic routing, service restarts, and overall system stability.
Why are Health Checks Crucial? The Benefits Unpacked
The value proposition of robust health checks extends far beyond mere diagnostics. They are foundational to building resilient, self-healing, and scalable applications. Let's delve into the multi-faceted benefits:
- Enhanced Reliability and High Availability: The primary driver for health checks is to ensure that users are always directed to functioning instances of your application. When a service instance becomes unhealthy (e.g., due to a memory leak, a crashed process, or an unreachable database), a properly configured health check will detect this anomaly. Load balancers and service orchestrators can then automatically remove the unhealthy instance from the rotation, preventing it from receiving new requests and thus improving the overall reliability of the service. This prevents partial outages from becoming full system failures.
- Faster Issue Detection and Remediation: Health checks act as an early warning system. By continuously probing your services, they can detect problems long before they manifest as user-reported errors. Imagine a database connection pool exhausting its limits – a deep health check can flag this immediately, allowing automated systems to attempt a restart or alert operations teams, significantly reducing mean time to recovery (MTTR).
- Graceful Deployments and Seamless Updates: In continuous integration/continuous deployment (CI/CD) pipelines, health checks are pivotal for zero-downtime deployments. Before a new version of your application is considered "live" and ready to receive production traffic, its health check endpoints are rigorously probed. Only when they report healthy status will the load balancer redirect traffic to the new instances. Conversely, during a graceful shutdown, a service can signal "unhealthy" to prevent new connections while it finishes processing existing ones, ensuring no data loss or abrupt disconnections.
- Optimized Resource Utilization: By enabling intelligent traffic routing, health checks ensure that computational resources are not wasted on serving requests to unresponsive instances. Moreover, in auto-scaling groups, health checks can inform decisions about scaling instances up or down based on their ability to perform work, rather than just raw CPU or memory metrics.
- Integration with Infrastructure Components: Health checks are not standalone features; they are the language spoken by your application to the surrounding infrastructure. This includes:
- Load Balancers: Distribute incoming network traffic across multiple servers. They rely on health checks to determine which servers are capable of handling requests.
- Container Orchestrators (e.g., Kubernetes): Manage the deployment, scaling, and operation of application containers. Kubernetes'
livenessandreadinessprobes are direct manifestations of health checks, dictating when a pod should be restarted or receive traffic. - Service Meshes (e.g., Istio, Linkerd): Provide features like traffic management, security, and observability for microservices. They use health checks to inform their routing decisions and resilience patterns.
API Gateways: Act as the single entry point for a group of microservices. They perform health checks on upstream services to ensure requests are only forwarded to healthy backends, playing a crucial role in overall system stability and performance.
Types of Health Checks: A Granular Approach
Not all health checks are created equal. Different types serve distinct purposes, providing varying levels of insight into your application's health. Understanding these distinctions is crucial for designing a comprehensive health strategy.
- Liveness Checks (Are You Alive?):
- Purpose: To determine if an application instance is running and in a functional state. If a liveness check fails, it indicates that the application is in such a bad state that it cannot recover on its own, and the orchestrator should restart it.
- Implementation: Often a very simple check, like ensuring the web server process is running and can respond to a basic HTTP request. It doesn't necessarily probe deeper dependencies.
- Example: A
GET /health/liveendpoint that just returns a 200 OK if the Python application process is up and listening.
- Readiness Checks (Are You Ready to Serve Traffic?):
- Purpose: To determine if an application instance is not only alive but also fully initialized and ready to receive user requests. An instance might be alive but not ready if it's still starting up, connecting to a database, loading configurations, or undergoing a large cache warm-up. If a readiness check fails, the instance should be temporarily removed from the pool of available services, but not necessarily restarted.
- Implementation: This typically involves deeper checks, such as verifying connectivity to databases, external
apis, message queues, caches, or ensuring internal data structures are populated. - Example: A
GET /health/readyendpoint that returns 200 OK only if the application can successfully ping its database, has a valid connection to a third-partyapi, and its internal services are initialized.
- Startup Checks (Are You Starting Correctly?):
- Purpose: Introduced more recently (notably in Kubernetes 1.16+), startup checks are designed for applications that have a long initialization time. They delay liveness and readiness checks until the application has successfully started, preventing premature restarts.
- Implementation: Similar to readiness checks but with a longer initial delay and potentially more lenient thresholds. Once successful, liveness and readiness checks take over.
- Example: For a large data processing
APIthat takes several minutes to load models into memory, a startup probe would monitor this loading process.
- Dependency Checks (Are Your Dependencies Healthy?):
- Purpose: These are often integrated into readiness checks but can also exist as separate, more granular endpoints (e.g.,
/health/db,/health/cache). They specifically verify the status of external services or resources that your application relies upon. - Implementation: Involves making calls to databases, external
APIs, message brokers, file systems, or other microservices to confirm their availability and responsiveness. This is where agatewaymight come into play, as the upstreamAPIs it manages would need their own dependency checks. - Example: Checking if a PostgreSQL database is reachable and accepting connections, or if a third-party payment
apican be called successfully.
- Purpose: These are often integrated into readiness checks but can also exist as separate, more granular endpoints (e.g.,
The distinction between liveness and readiness is paramount. An application could be alive (process running) but not ready (database connection failed). Restarting such an application might not resolve the underlying issue and could even exacerbate it by cycling through unavailable instances. Health checks provide the intelligence to differentiate these states, allowing infrastructure to react appropriately, whether by restarting, re-routing, or simply waiting.
Core Concepts and Principles for Effective Health Check Endpoints
Designing and implementing health check endpoints isn't just about returning a 200 OK. There's a methodology and a set of best practices that elevate them from mere pings to powerful diagnostic tools.
HTTP Status Codes: The Language of Health
The most fundamental aspect of any HTTP-based health check is the status code returned. This single piece of information is often all that load balancers and orchestrators need to make critical decisions.
- 200 OK: This is the universal sign of health. It indicates that the application (or the specific component being checked) is fully operational and ready to serve traffic.
- 5xx Server Error (e.g., 500 Internal Server Error, 503 Service Unavailable): Any 5xx status code indicates a problem.
500 Internal Server Errorgenerally means something went wrong inside the application while processing the health check.503 Service Unavailableis often used when the service is temporarily unable to handle the request (e.g., during maintenance, overloaded, or not yet ready). This is particularly useful for readiness checks where you don't want a restart but just want to remove the instance from traffic for a while.
- 4xx Client Error (e.g., 404 Not Found): While less common for health checks, a 404 might indicate a misconfigured health check path. Generally, health checks should aim for 2xx or 5xx.
The key is consistency. Define clear status code semantics for your health checks and adhere to them across all your services.
Response Format: Providing Granular Detail (JSON)
While a status code is sufficient for basic decisions, a well-designed health check can offer much more. Returning a JSON payload allows for granular insights into the status of various components, which is invaluable for debugging and monitoring.
A typical health check JSON response might look like this:
{
  "status": "UP",
  "details": {
    "application": {
      "status": "UP",
      "version": "1.2.3",
      "uptime": "PT1H30M20S"
    },
    "database": {
      "status": "UP",
      "message": "Successfully connected to PostgreSQL",
      "response_time_ms": 15
    },
    "external_api_service": {
      "status": "UP",
      "message": "Successfully called third-party API",
      "response_time_ms": 50
    },
    "cache": {
      "status": "DOWN",
      "error": "Redis connection refused"
    }
  }
}
This structured response allows monitoring systems to parse individual component statuses, trigger specific alerts, and provide a comprehensive dashboard view of the system's health. The top-level "status" should usually reflect the aggregated status of all critical components.
Timeouts: Preventing Health Checks from Becoming Bottlenecks
A health check that takes too long to respond defeats its purpose. If a health check itself gets stuck or becomes slow, it can lead to false positives (healthy service marked unhealthy) or worse, block the monitoring system. Always implement strict timeouts for your health checks and for any internal calls they make to dependencies. If a database check takes longer than, say, 100ms, it might be better to consider that dependency as "DOWN" for the purpose of the health check, even if it eventually responds. This proactive failure detection helps prevent degradation.
Security Considerations: Don't Expose Too Much
Health check endpoints typically do not require authentication because they are accessed by infrastructure components (load balancers, orchestrators) that don't usually have credentials for individual services. However, this open access means you must be cautious about the information you expose. * Avoid sensitive data: Do not return passwords, API keys, or other confidential configuration details. * Limit verbose error messages: While helpful for debugging, detailed stack traces or internal system errors in a public health check can be a security risk. * Rate Limiting (Optional): In some high-traffic scenarios or if concerned about DoS attacks on health checks, a lightweight rate limit could be considered, though it often adds complexity that outweighs the benefit for internal health checks. For API gateways, rate limiting is a common feature.
Granularity of Checks: Shallow vs. Deep
- Shallow Check (Liveness): A quick, surface-level check confirming the process is running and basic I/O is functional. It's fast and impacts performance minimally.
- Deep Check (Readiness/Dependency): Involves probing external dependencies and internal states. It provides a more accurate picture but consumes more resources and takes longer.
The choice between shallow and deep depends on the type of health check (liveness vs. readiness) and the specific needs of your infrastructure. Often, a combination is used: a shallow liveness check for quick restarts, and a deeper readiness check for intelligent traffic routing.
Active vs. Passive Checks
- Active Checks: The monitoring system (load balancer, orchestrator) actively pings the health check endpoint at regular intervals. This is the most common model.
- Passive Checks: The application itself reports its health status to a central monitoring system (e.g., via a metrics
APIor a pub/sub mechanism). This can be useful for complex, internal states but is harder to integrate with standard infrastructure components. For the scope of this article, we primarily focus on active HTTP health checks.
| Feature | Liveness Check | Readiness Check |
|---|---|---|
| Purpose | Determine if the application process is running and functional. If not, restart. | Determine if the application is ready to serve traffic. If not, remove from pool. |
| Common Use Case | Kubernetes livenessProbe, Docker container health. |
Kubernetes readinessProbe, Load Balancer health checks. |
| Response | Typically a quick 200 OK if process is alive. | May include deeper dependency checks, returns 200 OK when fully operational. |
| Action on Failure | Restart the application instance. | Temporarily stop routing traffic to the instance; do not necessarily restart. |
| Complexity | Usually simple, fast, and resource-light. | Can be more complex, involving external calls, potentially slower. |
| When to Fail | Process crashed, deadlocked, out of memory, unrecoverable state. | Still initializing, database unreachable, external API unresponsive, cache cold. |
This table highlights the fundamental distinctions that guide the implementation of each type of health check, emphasizing their respective roles in maintaining system stability.
Python Web Frameworks for Health Checks: Practical Implementations
Python offers a rich ecosystem of web frameworks, each providing elegant ways to expose API endpoints, including those for health checks. We'll explore Flask, FastAPI, and briefly touch upon Django, demonstrating how to implement simple yet effective health checks.
1. Flask: A Microframework for Simplicity
Flask is renowned for its minimalist design, making it an excellent choice for microservices and small APIs. Implementing a health check is straightforward.
Basic Setup: First, ensure you have Flask installed: pip install Flask
Simple Liveness Check:
# app.py
from flask import Flask, jsonify

app = Flask(__name__)

@app.route('/health/live', methods=['GET'])
def liveness_check():
    """
    A basic liveness check.
    Returns 200 OK if the application is running.
    """
    return jsonify({"status": "UP", "message": "Service is alive"}), 200

if __name__ == '__main__':
    app.run(host='0.0.0.0', port=5000)
To run this: python app.py Then, in your browser or with curl: curl http://127.0.0.1:5000/health/live You should see: {"message":"Service is alive","status":"UP"} with an HTTP 200 status.
Implementing a More Comprehensive Readiness Check with Dependencies: For a readiness check, we'll simulate dependencies like a database and an external API.
# app.py
import os
import time
import requests
from flask import Flask, jsonify

app = Flask(__name__)

# --- Configuration for simulated dependencies ---
DATABASE_UP = True # Simulate DB status
EXTERNAL_API_URL = "https://jsonplaceholder.typicode.com/posts/1" # A public test API
# Set this to False to simulate external API failure
EXTERNAL_API_MOCK_SUCCESS = os.getenv("EXTERNAL_API_MOCK_SUCCESS", "True").lower() == "true"

def check_database_connection():
    """
    Simulates checking database connectivity.
    In a real app, this would involve trying to connect/query the DB.
    """
    try:
        # Simulate a small delay for DB check
        time.sleep(0.01)
        if not DATABASE_UP:
            raise ConnectionError("Database connection failed")
        # In a real app:
        # with get_db_connection() as conn:
        #     cursor = conn.cursor()
        #     cursor.execute("SELECT 1")
        return {"status": "UP", "message": "Database connection successful"}
    except Exception as e:
        return {"status": "DOWN", "error": str(e)}

def check_external_api():
    """
    Simulates checking an external API's connectivity and responsiveness.
    """
    if not EXTERNAL_API_MOCK_SUCCESS:
        return {"status": "DOWN", "error": "Simulated external API failure"}

    try:
        # Make a quick, lightweight call to the external API
        response = requests.get(EXTERNAL_API_URL, timeout=1)
        response.raise_for_status() # Raise an exception for bad status codes (4xx or 5xx)
        return {"status": "UP", "message": f"External API reachable ({response.status_code})", "response_time_ms": int(response.elapsed.total_seconds() * 1000)}
    except requests.exceptions.Timeout:
        return {"status": "DOWN", "error": "External API request timed out"}
    except requests.exceptions.ConnectionError:
        return {"status": "DOWN", "error": "External API connection error"}
    except requests.exceptions.RequestException as e:
        return {"status": "DOWN", "error": f"External API request failed: {e}"}

@app.route('/health/live', methods=['GET'])
def liveness_check():
    """
    Basic liveness check: just confirm the Flask app is running.
    """
    return jsonify({"status": "UP", "message": "Service is alive"}), 200

@app.route('/health/ready', methods=['GET'])
def readiness_check():
    """
    Comprehensive readiness check: verifies internal and external dependencies.
    """
    overall_status = "UP"
    details = {}

    # Check database
    db_status = check_database_connection()
    details["database"] = db_status
    if db_status["status"] == "DOWN":
        overall_status = "DOWN"

    # Check external API
    external_api_status = check_external_api()
    details["external_api"] = external_api_status
    if external_api_status["status"] == "DOWN":
        overall_status = "DOWN"

    # You can add more checks here (e.g., cache, internal queues)
    # details["cache"] = check_cache_status()
    # if details["cache"]["status"] == "DOWN":
    #     overall_status = "DOWN"

    # Determine HTTP status code based on overall_status
    http_status_code = 200 if overall_status == "UP" else 503

    return jsonify({"status": overall_status, "details": details}), http_status_code

if __name__ == '__main__':
    # To simulate external API failure for readiness check:
    # Set environment variable before running: EXTERNAL_API_MOCK_SUCCESS=False python app.py
    app.run(host='0.0.0.0', port=5000, debug=True)
This Flask example demonstrates a clear separation between a simple liveness check and a more detailed readiness check that probes external dependencies. The readiness_check function aggregates the status of individual components and determines the overall health, returning an appropriate HTTP status code (200 for fully healthy, 503 for issues). This structured JSON response is immensely useful for automated monitoring and debugging.
2. FastAPI: Modern Asynchronous API Development
FastAPI, built on Starlette and Pydantic, brings modern asynchronous capabilities and automatic API documentation to Python web development. It's an excellent choice for high-performance APIs and microservices.
Basic Setup: Install FastAPI and an ASGI server like Uvicorn: pip install fastapi uvicorn requests
Implementing a Readiness Check with Dependencies (Async):
# main.py
import os
import asyncio
import httpx # Recommended for async HTTP requests
from fastapi import FastAPI, HTTPException
from pydantic import BaseModel

app = FastAPI(title="Health Check Example API")

# --- Configuration for simulated dependencies ---
DATABASE_UP = True # Simulate DB status
EXTERNAL_API_URL = "https://jsonplaceholder.typicode.com/posts/1" # A public test API
# Set this to False to simulate external API failure
EXTERNAL_API_MOCK_SUCCESS = os.getenv("EXTERNAL_API_MOCK_SUCCESS", "True").lower() == "true"

# Pydantic models for structured health response
class HealthComponentStatus(BaseModel):
    status: str # "UP" or "DOWN"
    message: str | None = None
    error: str | None = None
    response_time_ms: int | None = None

class HealthDetails(BaseModel):
    application: HealthComponentStatus
    database: HealthComponentStatus
    external_api: HealthComponentStatus

class OverallHealthStatus(BaseModel):
    status: str # "UP" or "DOWN"
    details: HealthDetails

async def check_database_connection_async():
    """
    Asynchronously simulates checking database connectivity.
    In a real app, this would use an async DB driver (e.g., asyncpg).
    """
    await asyncio.sleep(0.01) # Simulate async I/O
    if not DATABASE_UP:
        return HealthComponentStatus(status="DOWN", error="Database connection failed")
    return HealthComponentStatus(status="UP", message="Database connection successful")

async def check_external_api_async():
    """
    Asynchronously checks an external API's connectivity and responsiveness.
    Uses httpx for async HTTP requests.
    """
    if not EXTERNAL_API_MOCK_SUCCESS:
        return HealthComponentStatus(status="DOWN", error="Simulated external API failure")

    try:
        async with httpx.AsyncClient() as client:
            start_time = asyncio.get_event_loop().time()
            response = await client.get(EXTERNAL_API_URL, timeout=1)
            response.raise_for_status() # Raise an exception for bad status codes (4xx or 5xx)
            end_time = asyncio.get_event_loop().time()
            response_time_ms = int((end_time - start_time) * 1000)
            return HealthComponentStatus(
                status="UP",
                message=f"External API reachable ({response.status_code})",
                response_time_ms=response_time_ms
            )
    except httpx.TimeoutException:
        return HealthComponentStatus(status="DOWN", error="External API request timed out")
    except httpx.ConnectError:
        return HealthComponentStatus(status="DOWN", error="External API connection error")
    except httpx.HTTPStatusError as e:
        return HealthComponentStatus(status="DOWN", error=f"External API returned non-2xx status: {e.response.status_code}")
    except Exception as e:
        return HealthComponentStatus(status="DOWN", error=f"External API request failed: {e}")

@app.get("/techblog/en/health/live", response_model=HealthComponentStatus, summary="Liveness Check")
async def liveness_check():
    """
    Basic liveness check: just confirm the FastAPI app is running.
    """
    return HealthComponentStatus(status="UP", message="Service is alive")

@app.get("/techblog/en/health/ready", response_model=OverallHealthStatus, summary="Readiness Check")
async def readiness_check():
    """
    Comprehensive readiness check: verifies internal and external dependencies.
    """
    overall_status = "UP"

    # Run checks concurrently using asyncio.gather
    db_status, external_api_status = await asyncio.gather(
        check_database_connection_async(),
        check_external_api_async()
    )

    if db_status.status == "DOWN" or external_api_status.status == "DOWN":
        overall_status = "DOWN"

    # For application status in HealthDetails
    app_status = HealthComponentStatus(status="UP", message="Application running")
    if overall_status == "DOWN":
        # If any dependency is down, the app is not fully ready
        app_status.status = "DOWN"
        app_status.message = "Application not fully ready due to dependency issues"

    details = HealthDetails(
        application=app_status,
        database=db_status,
        external_api=external_api_status
    )

    # Determine HTTP status code based on overall_status
    http_status_code = 200 if overall_status == "UP" else 503

    # FastAPI handles JSON serialization and Pydantic model validation automatically
    # For returning a specific HTTP status code with a Pydantic model:
    if http_status_code == 503:
        raise HTTPException(status_code=503, detail=OverallHealthStatus(status=overall_status, details=details).model_dump())
    return OverallHealthStatus(status=overall_status, details=details)

if __name__ == '__main__':
    # To run this: uvicorn main:app --reload --host 0.0.0.0 --port 5000
    # To simulate external API failure: EXTERNAL_API_MOCK_SUCCESS=False uvicorn main:app --reload
    import uvicorn
    uvicorn.run(app, host='0.0.0.0', port=5000)
FastAPI's asynchronous nature, combined with httpx for async HTTP requests, allows for efficient, non-blocking dependency checks. The use of Pydantic models for the response ensures schema validation and automatic documentation, enhancing the maintainability and clarity of the health check API. asyncio.gather is a powerful tool here, enabling concurrent execution of independent checks, which significantly speeds up the readiness probe.
3. Django: For Larger Web Applications
Django, a full-stack framework, also supports health checks. For RESTful APIs, Django REST Framework (DRF) is commonly used.
Basic Setup: Install Django and DRF: pip install Django djangorestframework
Implementing a Health Check in Django with DRF:
# myproject/myproject/urls.py
from django.contrib import admin
from django.urls import path, include

urlpatterns = [
    path('admin/', admin.site.urls),
    path('api/', include('myapp.urls')), # Assuming 'myapp' handles health checks
]

# myproject/myapp/views.py
import os
import requests
from rest_framework.views import APIView
from rest_framework.response import Response
from rest_framework import status

# --- Configuration for simulated dependencies ---
DATABASE_UP = True # Simulate DB status
EXTERNAL_API_URL = "https://jsonplaceholder.typicode.com/posts/1" # A public test API
EXTERNAL_API_MOCK_SUCCESS = os.getenv("EXTERNAL_API_MOCK_SUCCESS", "True").lower() == "true"

def check_database_connection_django():
    """
    Simulates checking database connectivity for Django.
    In a real app, you'd use Django's ORM or DB connections directly.
    """
    try:
        from django.db import connection
        with connection.cursor() as cursor:
            cursor.execute("SELECT 1")
        return {"status": "UP", "message": "Database connection successful"}
    except Exception as e:
        # Fallback to simulated status if real DB check fails or is not configured
        if not DATABASE_UP:
            return {"status": "DOWN", "error": "Simulated database connection failed"}
        return {"status": "DOWN", "error": f"Database error: {e}"}

def check_external_api_django():
    """
    Checks an external API's connectivity and responsiveness.
    """
    if not EXTERNAL_API_MOCK_SUCCESS:
        return {"status": "DOWN", "error": "Simulated external API failure"}

    try:
        response = requests.get(EXTERNAL_API_URL, timeout=1)
        response.raise_for_status()
        return {"status": "UP", "message": f"External API reachable ({response.status_code})", "response_time_ms": int(response.elapsed.total_seconds() * 1000)}
    except requests.exceptions.Timeout:
        return {"status": "DOWN", "error": "External API request timed out"}
    except requests.exceptions.ConnectionError:
        return {"status": "DOWN", "error": "External API connection error"}
    except requests.exceptions.RequestException as e:
        return {"status": "DOWN", "error": f"External API request failed: {e}"}

class LivenessCheckView(APIView):
    authentication_classes = [] # No auth required
    permission_classes = []     # No permissions required

    def get(self, request, *args, **kwargs):
        return Response({"status": "UP", "message": "Service is alive"}, status=status.HTTP_200_OK)

class ReadinessCheckView(APIView):
    authentication_classes = [] # No auth required
    permission_classes = []     # No permissions required

    def get(self, request, *args, **kwargs):
        overall_status = "UP"
        details = {}

        db_status = check_database_connection_django()
        details["database"] = db_status
        if db_status["status"] == "DOWN":
            overall_status = "DOWN"

        external_api_status = check_external_api_django()
        details["external_api"] = external_api_status
        if external_api_status["status"] == "DOWN":
            overall_status = "DOWN"

        response_status = status.HTTP_200_OK if overall_status == "UP" else status.HTTP_503_SERVICE_UNAVAILABLE

        return Response({"status": overall_status, "details": details}, status=response_status)

# myproject/myapp/urls.py
from django.urls import path
from myapp.views import LivenessCheckView, ReadinessCheckView

urlpatterns = [
    path('health/live', LivenessCheckView.as_view(), name='liveness_check'),
    path('health/ready', ReadinessCheckView.as_view(), name='readiness_check'),
]
In Django, health checks are implemented as standard views, often using APIView from DRF for convenient JSON responses and status code management. The principles remain the same: probe dependencies, aggregate results, and return an appropriate HTTP status code and detailed JSON payload. Django's ORM and database connection management would be utilized for real database checks, providing a robust way to ensure data layer availability.
Simple Example: A Python Health Check Service with Flask
Let's consolidate the knowledge and create a single, runnable Flask application that serves as a simple yet effective health check endpoint for a hypothetical microservice. This service depends on a database (simulated) and an external API.
# health_app.py
import os
import time
import requests
from flask import Flask, jsonify, request

app = Flask(__name__)

# --- Configuration Variables ---
# Simulate database availability (set to False to simulate DB downtime)
SIMULATE_DB_UP = os.getenv("SIMULATE_DB_UP", "true").lower() == "true"
# URL for an external API dependency (e.g., a public test API)
EXTERNAL_DEPENDENCY_API_URL = os.getenv(
    "EXTERNAL_DEPENDENCY_API_URL", "https://jsonplaceholder.typicode.com/posts/1"
)
# Simulate external API availability (set to False to simulate external API issues)
SIMULATE_EXTERNAL_API_UP = os.getenv("SIMULATE_EXTERNAL_API_UP", "true").lower() == "true"
# Timeout for external API calls in seconds
EXTERNAL_API_TIMEOUT = int(os.getenv("EXTERNAL_API_TIMEOUT", "1"))
# Port to run the Flask app on
APP_PORT = int(os.getenv("APP_PORT", "5000"))

# --- Helper Functions for Dependency Checks ---

def check_database():
    """
    Performs a simulated database connection check.
    In a real application, this would involve connecting to your actual database
    (e.g., PostgreSQL, MySQL) and executing a lightweight query.
    """
    start_time = time.monotonic()
    try:
        if not SIMULATE_DB_UP:
            raise ConnectionRefusedError("Simulated database connection refused.")
        # Simulate database operation delay
        time.sleep(0.02) # 20ms delay
        return {
            "name": "Database",
            "status": "UP",
            "message": "Connected successfully to the database.",
            "response_time_ms": int((time.monotonic() - start_time) * 1000)
        }
    except Exception as e:
        return {
            "name": "Database",
            "status": "DOWN",
            "error": str(e),
            "response_time_ms": int((time.monotonic() - start_time) * 1000)
        }

def check_external_api_dependency():
    """
    Checks the connectivity and responsiveness of an external API.
    Uses 'requests' library for HTTP GET requests.
    """
    start_time = time.monotonic()
    try:
        if not SIMULATE_EXTERNAL_API_UP:
            raise requests.exceptions.ConnectionError("Simulated external API connection refused.")

        response = requests.get(EXTERNAL_DEPENDENCY_API_URL, timeout=EXTERNAL_API_TIMEOUT)
        response.raise_for_status() # Raises HTTPError for 4xx/5xx responses

        return {
            "name": "ExternalServiceAPI",
            "status": "UP",
            "message": f"External API reachable (HTTP {response.status_code}).",
            "response_time_ms": int((time.monotonic() - start_time) * 1000)
        }
    except requests.exceptions.Timeout:
        return {
            "name": "ExternalServiceAPI",
            "status": "DOWN",
            "error": f"External API timed out after {EXTERNAL_API_TIMEOUT}s.",
            "response_time_ms": int((time.monotonic() - start_time) * 1000)
        }
    except requests.exceptions.ConnectionError as e:
        return {
            "name": "ExternalServiceAPI",
            "status": "DOWN",
            "error": f"Could not connect to external API: {e}.",
            "response_time_ms": int((time.monotonic() - start_time) * 1000)
        }
    except requests.exceptions.HTTPError as e:
        return {
            "name": "ExternalServiceAPI",
            "status": "DOWN",
            "error": f"External API returned non-2xx status: {e.response.status_code}.",
            "response_time_ms": int((time.monotonic() - start_time) * 1000)
        }
    except Exception as e:
        return {
            "name": "ExternalServiceAPI",
            "status": "DOWN",
            "error": f"An unexpected error occurred: {str(e)}.",
            "response_time_ms": int((time.monotonic() - start_time) * 1000)
        }

# --- Health Check Endpoints ---

@app.route('/health/live', methods=['GET'])
def liveness_check():
    """
    Liveness probe: Simple check to see if the application process is running.
    This should be very fast and minimal.
    """
    app_status = {
        "name": "Application",
        "status": "UP",
        "message": "Application process is running."
    }
    return jsonify({"status": "UP", "details": [app_status]}), 200

@app.route('/health/ready', methods=['GET'])
def readiness_check():
    """
    Readiness probe: Checks the health of critical dependencies like
    the database and external APIs. If any critical dependency is down,
    the service is marked as not ready to receive traffic.
    """
    overall_status = "UP"
    details = []

    # Check application core status
    app_core_status = {
        "name": "ApplicationCore",
        "status": "UP",
        "message": "Core application logic is functional."
    }
    details.append(app_core_status)

    # Check Database
    db_check_result = check_database()
    details.append(db_check_result)
    if db_check_result["status"] == "DOWN":
        overall_status = "DOWN"

    # Check External API Dependency
    external_api_check_result = check_external_api_dependency()
    details.append(external_api_check_result)
    if external_api_check_result["status"] == "DOWN":
        overall_status = "DOWN"

    # Determine HTTP status code based on overall health
    http_status_code = 200 if overall_status == "UP" else 503 # Service Unavailable

    response_payload = {
        "status": overall_status,
        "timestamp": time.time(),
        "details": details
    }
    return jsonify(response_payload), http_status_code

@app.route('/health', methods=['GET'])
def combined_health_check():
    """
    A combined health endpoint that can optionally run deep checks.
    This could be used by a gateway or internal monitoring.
    """
    # A simple liveness check
    liveness_response, liveness_code = liveness_check()
    if liveness_code != 200:
        return liveness_response, liveness_code

    # If 'deep' query parameter is present, run readiness checks
    if request.args.get('deep', 'false').lower() == 'true':
        readiness_response, readiness_code = readiness_check()
        return readiness_response, readiness_code
    else:
        # Default to liveness if no deep check requested
        return liveness_response, liveness_code

# --- Main entry point ---
if __name__ == '__main__':
    print(f"Starting Flask health check app on port {APP_PORT}...")
    print(f"Database simulation UP: {SIMULATE_DB_UP}")
    print(f"External API simulation UP: {SIMULATE_EXTERNAL_API_UP}")
    print(f"External API URL: {EXTERNAL_DEPENDENCY_API_URL}")
    app.run(host='0.0.0.0', port=APP_PORT, debug=True)
How to Run and Test This Example:
- Save the code: Save the above code as
health_app.py. - Install Flask and Requests:
pip install Flask requests - Run the application (healthy state):
python health_app.py- Test liveness:
curl http://127.0.0.1:5000/health/live(Should return 200 OK) - Test readiness:
curl http://127.0.0.1:5000/health/ready(Should return 200 OK with DB and ExternalAPIUP) - Test combined (shallow):
curl http://127.0.0.1:5000/health(Should return liveness check) - Test combined (deep):
curl http://127.0.0.1:5000/health?deep=true(Should return readiness check)
- Test liveness:
- Simulate Database Down:
SIMULATE_DB_UP=false python health_app.py- Test liveness:
curl http://127.0.0.1:5000/health/live(Still 200 OK, as liveness doesn't check DB) - Test readiness:
curl http://127.0.0.1:5000/health/ready(Should return 503 Service Unavailable, with Database DOWN in details)
- Test liveness:
- Simulate External API Down:
SIMULATE_EXTERNAL_API_UP=false python health_app.py- Test liveness:
curl http://127.0.0.1:5000/health/live(Still 200 OK) - Test readiness:
curl http://127.0.0.1:5000/health/ready(Should return 503 Service Unavailable, with ExternalServiceAPI DOWN in details)
- Test liveness:
This example provides a robust foundation for health checks, distinguishing between liveness and readiness, probing critical dependencies, and returning detailed, machine-readable responses. It’s a "simple example" in terms of its direct implementation, but its principles are scalable to complex microservice architectures.
APIPark is a high-performance AI gateway that allows you to securely access the most comprehensive LLM APIs globally on the APIPark platform, including OpenAI, Anthropic, Mistral, Llama2, Google Gemini, and more.Try APIPark now! 👇👇👇
Advanced Health Check Scenarios and Strategies
Beyond the basic liveness and readiness probes, advanced strategies can further enhance the robustness and resilience of your services.
Asynchronous Checks for Non-Blocking Operations
As demonstrated with FastAPI, performing dependency checks asynchronously is crucial for performance. If a health check itself blocks due to a slow external API call or database query, it can introduce latency or even deadlock the application. Python's asyncio module, combined with async HTTP clients (httpx) and async database drivers, allows health checks to run without tying up the main thread, ensuring the health endpoint remains responsive even when dependencies are slow. This is particularly important in high-throughput API services where every millisecond counts.
Integrating with Circuit Breaker Patterns
Health checks can work in concert with circuit breaker patterns for enhanced fault tolerance. A circuit breaker monitors failures to a specific external service. If the failure rate crosses a threshold, the circuit "trips," preventing further calls to that service and redirecting them to a fallback, thus giving the failing service time to recover and preventing cascading failures. A health check might then be used to determine when the circuit can be "half-open," attempting a single request to see if the service has recovered, or to fully "close" the circuit when the dependency is reliably healthy again. This reduces the load on struggling services and improves overall system resilience.
Graceful Shutdown and Deregistration
When an application instance needs to be shut down (e.g., for deployment, scaling down, or maintenance), health checks facilitate a graceful exit. Before terminating, the application can set its readiness check to "DOWN" (e.g., return 503). This signals to the load balancer or API gateway to stop sending new traffic to this instance. The instance then enters a drainage period, allowing it to finish processing existing requests before finally shutting down. This ensures that no in-flight requests are abruptly terminated, preserving data integrity and improving user experience.
Metrics and Monitoring Integration
The detailed information provided by health checks (e.g., status of individual components, response times) is invaluable for observability. This data can be exported as metrics to monitoring systems like Prometheus, Grafana, or Datadog. By collecting and visualizing health check metrics, operations teams can: * Track the historical health of services and dependencies. * Set up alerts for specific component failures (e.g., "database connection down for service X"). * Identify trends or intermittent issues that might not trigger immediate restarts but indicate underlying problems. * Understand the performance impact of dependency checks.
This level of insight moves beyond simply "up" or "down" to a more proactive and diagnostic approach to system health.
Dynamic Configuration for Health Checks
In some complex environments, the parameters for health checks (e.g., which dependencies to check, timeout values, retry counts) might need to be dynamic. This could involve: * Loading configuration from environment variables (as in our example). * Fetching configuration from a centralized configuration service (e.g., Consul, Etcd). * Providing API endpoints to temporarily disable or enable certain checks during debugging or maintenance.
Dynamic configuration allows for greater flexibility and adaptability without requiring service redeployments, especially in rapidly evolving microservice landscapes.
Integration with Infrastructure Components
Health checks truly shine when integrated seamlessly with the surrounding infrastructure. They are the communication bridge between your application's internal state and the external systems that manage its lifecycle and traffic.
Load Balancers
Load balancers (e.g., AWS ELB/ALB, Google Cloud Load Balancer, NGINX, HAProxy) sit at the forefront of your infrastructure, distributing incoming client requests across multiple instances of your application. Their primary mechanism for doing so intelligently is through health checks. * How they work: Load balancers periodically send HTTP requests to the configured health check endpoint (e.g., /health/ready) of each registered instance. * Routing decisions: If an instance returns a 200 OK, the load balancer considers it healthy and continues to route traffic to it. If it returns a 5xx error or fails to respond within a timeout, the instance is marked unhealthy and taken out of the traffic rotation. * Configuration: You typically configure the health check path, port, protocol, interval, timeout, and the number of consecutive successful/failed checks before changing an instance's status. Robust health checks are essential for the load balancer to correctly manage service availability, preventing requests from being sent to failing application instances and ensuring a smooth user experience.
Container Orchestrators (Kubernetes)
Kubernetes has a highly sophisticated built-in mechanism for health checks through its probes. These probes directly leverage the concepts of liveness, readiness, and startup checks to manage container lifecycles.
- Liveness Probes:
- Purpose: To know when to restart a container. If a liveness probe fails, Kubernetes will terminate the container and restart it.
- Configuration (YAML example):
yaml livenessProbe: httpGet: path: /health/live port: 5000 initialDelaySeconds: 5 # Give the app 5 seconds to start periodSeconds: 10 # Check every 10 seconds timeoutSeconds: 1 # Fail if no response within 1 second failureThreshold: 3 # Restart if 3 consecutive checks fail
- Readiness Probes:
- Purpose: To know when a container is ready to start accepting traffic. If a readiness probe fails, Kubernetes removes the Pod's IP address from the endpoints of all Services, preventing traffic from being routed to it. When it succeeds, the Pod is added back.
- Configuration (YAML example):
yaml readinessProbe: httpGet: path: /health/ready port: 5000 initialDelaySeconds: 15 # Give the app more time for dependencies to initialize periodSeconds: 20 # Check every 20 seconds timeoutSeconds: 2 # Fail if no response within 2 seconds failureThreshold: 2 # Unready if 2 consecutive checks fail
- Startup Probes:
- Purpose: For applications with long startup times. If configured, liveness and readiness probes are disabled until the startup probe succeeds.
- Configuration (YAML example):
yaml startupProbe: httpGet: path: /health/live port: 5000 initialDelaySeconds: 0 periodSeconds: 5 failureThreshold: 12 # Allow up to 1 minute (12 * 5s) for startup
These Kubernetes probes are incredibly powerful, forming the backbone of self-healing and zero-downtime deployments in containerized environments. Crafting precise and efficient health check endpoints is paramount for leveraging Kubernetes' full potential.
Service Meshes
Service meshes (e.g., Istio, Linkerd, Consul Connect) add another layer of intelligent traffic management and observability to microservices. They often leverage and enhance the health information provided by applications. * Enhanced Traffic Routing: Service meshes can combine application-level health checks with network-level health checks (e.g., TCP connections) to make even finer-grained routing decisions, for instance, during canary deployments or A/B testing. * Intelligent Retries and Timeouts: They can use health status to inform their retry policies and timeout configurations, only retrying requests to healthy instances and giving up faster on unresponsive ones. * Traffic Shaping and Circuit Breaking: Service meshes can dynamically adjust traffic flows based on the health and load of services, implementing advanced resilience patterns.
API Gateways: The Entry Point to Your Services
An API gateway acts as the single entry point for all client requests to your microservices. It's responsible for routing requests to the correct backend service, applying policies like authentication, authorization, rate limiting, and often performing caching or transformations. For a robust API gateway, understanding the health of its upstream services is absolutely critical.
A well-designed API gateway uses health checks to: 1. Prevent Request Forwarding to Unhealthy Services: The gateway continuously monitors the health endpoints of the backend services it routes to. If a service becomes unhealthy, the gateway stops forwarding requests to it, gracefully degrading service or returning an appropriate error to the client, preventing internal errors from propagating outwards. This is a fundamental layer of defense for any distributed API architecture. 2. Facilitate Load Balancing: Similar to dedicated load balancers, API gateways distribute traffic among multiple instances of a healthy service, often employing sophisticated algorithms that factor in health status and real-time load. 3. Enable Graceful Degradation and Fallbacks: If a critical backend service is completely unavailable, the API gateway can be configured to serve a cached response, a default response, or redirect to a static error page, preventing a complete outage. 4. Support Dynamic Service Discovery: In dynamic environments, API gateways might integrate with service discovery mechanisms (like Consul or Eureka) which themselves rely on health checks to register and deregister service instances.
This is where a product like APIPark demonstrates its value. As an Open Source AI Gateway & API Management Platform, APIPark is designed to manage, integrate, and deploy both AI and REST services with ease. Its capability to integrate over 100+ AI models and encapsulate prompts into REST APIs means it must be exceptionally robust in managing the reliability of its numerous upstream services. APIPark, acting as a sophisticated gateway, inherently leverages well-implemented health checks to ensure that requests for AI inference or other API functionalities are only routed to healthy and ready-to-serve backend components. Its "End-to-End API Lifecycle Management" and "Performance Rivaling Nginx" directly benefit from timely and accurate health status of upstream services to provide high availability and a seamless user experience, even under high traffic loads (over 20,000 TPS). The platform's "Detailed API Call Logging" and "Powerful Data Analysis" also contribute by helping identify trends in health status, troubleshoot issues, and ensure the stability and security of all managed APIs. By providing a unified API format for AI invocation, APIPark effectively shields consuming applications from the complexities of underlying model changes or failures, making robust health checks on those internal AI services even more crucial for maintaining service integrity. This ensures that the promise of rapid integration and simplified API usage holds true, even when underlying services encounter transient issues.
Best Practices for Health Check Endpoints
To ensure your health checks are effective and beneficial, adhere to these best practices:
- Keep Liveness Checks Lightweight and Fast: A liveness check should ideally respond in milliseconds. Avoid complex logic or external calls that could introduce latency or false negatives. Its sole purpose is to determine if the process is alive.
- Distinguish Liveness from Readiness: Do not conflate the two. An application might be alive but not ready to serve traffic. Use separate endpoints and distinct logic for each.
- Use Appropriate HTTP Status Codes:
200 OKfor healthy,5xxfor unhealthy (typically503 Service Unavailablefor readiness failures, or500 Internal Server Errorfor liveness failures that indicate a fundamental crash). - Provide Meaningful Details in JSON Responses: While not strictly necessary for basic infrastructure, detailed JSON responses for readiness checks are invaluable for debugging, monitoring, and providing context to operations teams.
- Implement Timeouts for All Dependency Checks: Prevent individual dependency checks from hanging indefinitely. A quick failure is better than a slow response for a health check.
- Secure Health Checks (if public-facing): While typically internal, if a health check endpoint is exposed publicly, ensure it doesn't leak sensitive information. For internal checks, standard network segmentation is usually sufficient.
- Test Your Health Checks Thoroughly: Test not only the "UP" state but also various "DOWN" scenarios (e.g., database unreachable, external
APIerror, out of memory). Ensure your health checks correctly report problems. - Document Your Health Checks: Clearly define the behavior of each health check endpoint, what it checks, and what status codes and response payloads mean. This is crucial for anyone configuring load balancers or orchestrators.
- Monitor Health Check Response Times: Excessive latency in health checks can indicate underlying performance issues in your application or its dependencies, even if they return "UP."
- Avoid Writes/Side Effects: Health checks should be idempotent
GETrequests. They should never modify the state of your application or its data. - Consider Health Check Specific Configuration: Allow certain health check parameters (e.g., dependency URLs, timeouts) to be configured via environment variables or a configuration service, enabling adaptation to different deployment environments.
Common Pitfalls and How to Avoid Them
Even with the best intentions, health checks can sometimes introduce new problems if not designed carefully.
- Flaky Health Checks:
- Pitfall: Health checks that intermittently fail due to transient network issues or race conditions, leading to unnecessary restarts or traffic redirection.
- Avoid: Implement retry logic within dependency checks. Use slightly longer timeouts and higher
failureThresholdvalues (in Kubernetes) to tolerate brief transient issues. Ensure the checks are truly representative of service health.
- Overly Complex or Slow Health Checks:
- Pitfall: Health checks that perform extensive computations, complex database queries, or numerous external
APIcalls, becoming performance bottlenecks themselves. - Avoid: Keep liveness checks extremely lightweight. For readiness checks, ensure dependency checks are optimized, use
asyncwhere possible, and set strict timeouts. Only check critical dependencies.
- Pitfall: Health checks that perform extensive computations, complex database queries, or numerous external
- Not Distinguishing Liveness from Readiness:
- Pitfall: Using a single endpoint for both, leading to scenarios where a struggling but recoverable service is repeatedly restarted (liveness behavior) instead of just being temporarily taken out of traffic (readiness behavior).
- Avoid: Always have separate
/health/liveand/health/readyendpoints with distinct logic, especially when deploying to Kubernetes.
- Exposing Sensitive Information:
- Pitfall: Accidentally including configuration secrets, internal IP addresses, or verbose error logs in health check responses, which could be exploited.
- Avoid: Be diligent about sanitizing responses. Only return status, simple messages, and timing information. Never expose raw exceptions or stack traces.
- Lack of Logging and Alerting:
- Pitfall: Health check failures go unnoticed because there are no alerts or proper logging for failed checks.
- Avoid: Ensure your monitoring system is configured to alert on sustained health check failures. Log detailed information internally when a check transitions from UP to DOWN.
- Health Check Dependencies on Self:
- Pitfall: A health check inadvertently depends on a component that it is supposed to be checking, creating a circular dependency or an unrecoverable state if that component fails.
- Avoid: Design health checks to be as independent as possible, especially for core liveness. For readiness, clearly define and isolate the dependencies being checked.
Conclusion: The Unsung Hero of Modern Software
In the dynamic and often tumultuous world of microservices and cloud-native applications, health check endpoints, while seemingly simple, emerge as one of the most critical components for maintaining system reliability, availability, and resilience. They serve as the eyes and ears of your infrastructure, enabling automated systems to make intelligent decisions about service lifecycle management, traffic routing, and fault recovery. From ensuring zero-downtime deployments to gracefully handling dependency failures, well-implemented health checks are the unsung heroes that keep complex distributed systems humming smoothly.
By distinguishing between liveness and readiness, meticulously probing critical dependencies, leveraging appropriate HTTP status codes, and providing granular, machine-readable details, developers can build robust health check mechanisms in Python that integrate seamlessly with load balancers, container orchestrators like Kubernetes, and sophisticated API gateways such as APIPark. These integrations transform basic diagnostics into powerful tools for self-healing and proactive management.
The journey from a "simple example" to a production-grade health check involves adherence to best practices, careful consideration of common pitfalls, and a deep understanding of how your application interacts with its operational environment. Embracing these principles empowers development teams to build more dependable APIs and services, fostering user trust and operational confidence in an ever-evolving digital landscape. As systems continue to grow in complexity, the foundational role of robust health checks will only become more pronounced, solidifying their status as an indispensable cornerstone of modern software engineering.
Frequently Asked Questions (FAQ)
1. What is the difference between a liveness check and a readiness check?
A liveness check determines if an application instance is running and healthy enough to continue operating. If it fails, the orchestrator (e.g., Kubernetes) will typically restart the instance, assuming it's in an unrecoverable state. A readiness check, on the other hand, determines if an application instance is ready to receive network traffic. If it fails, the instance is temporarily removed from the pool of available services, but not necessarily restarted, allowing it to complete initialization or recover from a transient issue before traffic is routed back to it.
2. Why should health checks return HTTP status codes like 200 or 503 instead of just a boolean?
HTTP status codes are a standardized and universally understood way to communicate the outcome of a request over the web. Load balancers, API gateways, and container orchestrators are designed to interpret these codes directly. A 200 OK clearly signifies success and health, while a 503 Service Unavailable explicitly indicates that the service is temporarily unable to handle requests, allowing the infrastructure to react appropriately (e.g., take the instance out of rotation). Using standardized codes makes integration easier and more consistent across different systems.
3. Should health check endpoints be secured with authentication?
Generally, internal health check endpoints are not secured with authentication because they are accessed by infrastructure components (like load balancers or Kubernetes probes) that typically don't carry credentials for individual services. Instead, network-level security (e.g., firewalls, private subnets) is used to restrict access to these endpoints. However, if a health check endpoint is exposed publicly or contains sensitive diagnostic information, it should absolutely be secured and carefully designed to avoid information leakage.
4. How often should health checks be performed, and what timeouts should be used?
The frequency and timeouts depend on the type of check and the application's characteristics. * Liveness checks should be frequent (e.g., every 5-10 seconds) and have very short timeouts (e.g., 1-2 seconds) to quickly detect and restart crashed processes. * Readiness checks can be less frequent (e.g., every 10-30 seconds) and might have slightly longer timeouts (e.g., 2-5 seconds) to allow for deeper dependency checks. * For individual dependency checks within a readiness probe, always set strict, short timeouts (e.g., 100-500ms) to prevent the health check itself from becoming a bottleneck.
Adjusting these parameters often involves balancing prompt failure detection with avoiding "flaky" checks due to transient network issues.
5. How do health checks help with API gateway management, especially for products like APIPark?
Health checks are crucial for API gateways because the gateway acts as the single point of entry for all incoming API requests and routes them to various backend services. A robust API gateway like APIPark relies on health checks to: 1. Ensure Reliability: By continuously monitoring the health endpoints of upstream services, APIPark prevents requests from being routed to unhealthy or unresponsive backends, ensuring that clients only interact with functional services. 2. Facilitate Load Balancing: APIPark uses health status to intelligently distribute traffic across multiple healthy instances of a service, optimizing resource utilization and performance. 3. Support Dynamic Operations: In managing potentially hundreds of APIs, including integrating 100+ AI models, APIPark needs accurate, real-time health information to handle service scaling, deployments, and failures gracefully, thus providing seamless API invocation and managing the entire API lifecycle effectively.
🚀You can securely and efficiently call the OpenAI API on APIPark in just two steps:
Step 1: Deploy the APIPark AI gateway in 5 minutes.
APIPark is developed based on Golang, offering strong product performance and low development and maintenance costs. You can deploy APIPark with a single command line.
curl -sSO https://download.apipark.com/install/quick-start.sh; bash quick-start.sh

In my experience, you can see the successful deployment interface within 5 to 10 minutes. Then, you can log in to APIPark using your account.

Step 2: Call the OpenAI API.