Fix "Works Queue Full" Errors: A Troubleshooting Guide


In the intricate world of modern distributed systems, where services constantly communicate and data flows incessantly, the unexpected hiccup can quickly escalate into a catastrophic outage. Among the many potential points of failure, the dreaded "Works Queue Full" error stands out as a particularly insidious and challenging problem. This error, often indicative of an overwhelmed system component unable to process incoming tasks efficiently, can manifest in various forms across different technologies and architectures. Whether it's a web server, a message broker, a database connection pool, or critically, an api gateway struggling under immense pressure, the underlying message is clear: the system's capacity to handle new work has been exhausted. Understanding and effectively resolving this error is not merely about patching a problem; it’s about fortifying the resilience and scalability of your entire infrastructure.
This guide delves deep into the mechanics of the "Works Queue Full" error, exploring its root causes, offering systematic diagnostic strategies, and presenting a repertoire of both immediate and long-term solutions. We will navigate through common scenarios, dissect the role of crucial components like the gateway in managing traffic, and equip you with the knowledge to not only fix these errors when they arise but to architect systems that proactively prevent them. For those managing advanced systems, particularly those integrating artificial intelligence, we will also consider the unique challenges and solutions pertinent to an AI Gateway facing similar pressure. By the end of this comprehensive exploration, you will possess a robust framework for identifying, understanding, and permanently eradicating the "Works Queue Full" error, ensuring the stability and performance of your critical services.
Understanding "Works Queue Full": The Core Problem
At its heart, the "Works Queue Full" error signals a fundamental imbalance between the rate at which tasks arrive and the rate at which they can be processed. To truly grasp this, we must first understand the concept of a "work queue" itself. In most computing systems designed to handle concurrent operations, tasks are not processed immediately upon arrival. Instead, they are often placed into a temporary holding area—a queue—where they await an available "worker" or processing unit. These workers might be threads in a thread pool, dedicated processes, or even specific hardware resources. This queuing mechanism serves several vital purposes: it smooths out bursts of activity, prevents system components from being overwhelmed by simultaneous requests, and allows for efficient resource utilization by ensuring workers always have tasks to perform.
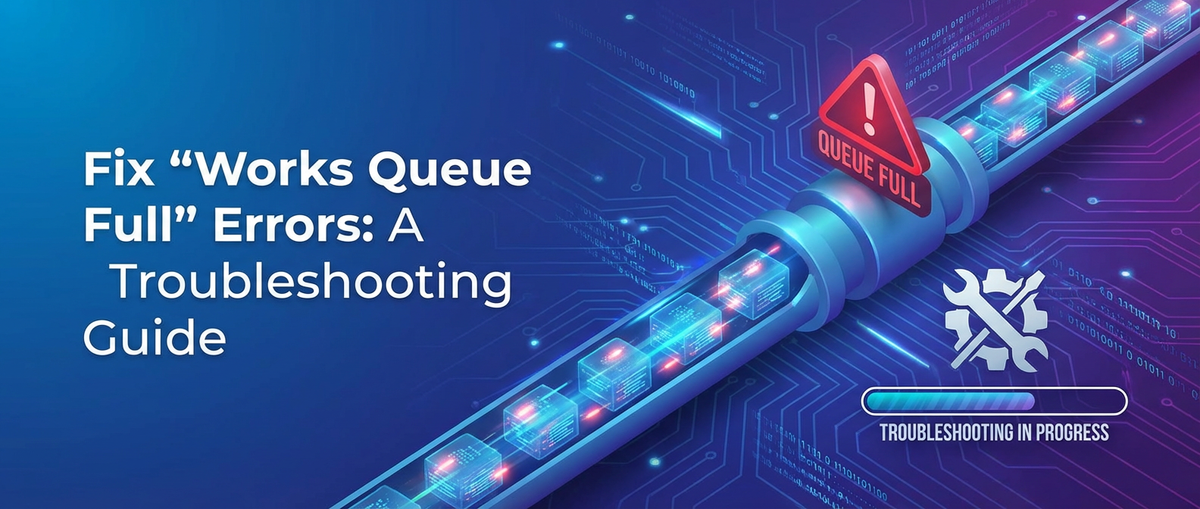
When a system reports "Works Queue Full," it means this designated waiting area has reached its maximum capacity. New tasks arriving cannot be added to the queue and are therefore rejected or dropped. This rejection can manifest as various errors to the client, commonly 5xx HTTP status codes (e.g., 503 Service Unavailable, 504 Gateway Timeout), or specific application-level exceptions. The implications of a full work queue are far-reaching and detrimental.
The Anatomy of a Work Queue
To elaborate, consider a typical server application, perhaps a web server or a microservice responsible for handling API requests. When an incoming request arrives, it's often initially accepted by a network listener and then placed into a queue. A pool of worker threads constantly monitors this queue, picking up tasks (requests) as they become available. Each worker then processes its task, which might involve complex business logic, database queries, or calls to other services. Once the worker completes its task, it returns to the pool, ready to pick up the next item from the queue. This model is highly efficient for managing fluctuating loads and optimizing resource use.
The queue itself has a finite capacity, whether defined by the number of concurrent connections, the size of a buffer in memory, or a specific configuration parameter. This limit is crucial for preventing the system from consuming excessive resources and ultimately crashing if the incoming load is too high or if workers become unresponsive. If the queue were unbounded, an influx of requests could lead to memory exhaustion, eventually bringing the entire system down in a more catastrophic manner.
Why Does It Get "Full"?
The reasons behind a work queue becoming full are multifaceted, but they generally boil down to a mismatch between supply (processing capacity) and demand (incoming workload).
- Overload (Demand Exceeds Supply): This is the most straightforward cause. The volume of incoming requests or tasks simply exceeds the rate at which the system's workers can process them. Imagine a popular online store during a flash sale – a sudden, massive surge in traffic can easily overwhelm even well-provisioned servers if the scaling mechanisms aren't rapid enough or if a hard limit on queue size is hit. A critical api gateway acting as the entry point for numerous services is particularly susceptible to this if not properly configured and scaled.
- Slow Workers (Supply Is Inefficient): Even if the nominal processing capacity seems sufficient, individual workers might become slow or stalled. This could be due to:
- Backend Service Latency: If workers depend on external services (databases, third-party APIs, other microservices) that are experiencing high latency or downtime, the workers will spend more time waiting for responses rather than processing new tasks. This effectively reduces the "effective" number of available workers.
- Resource Contention: Workers might be competing for limited shared resources such as CPU cycles, memory bandwidth, disk I/O, or database connection pools. High contention leads to delays in task completion.
- Inefficient Code: Unoptimized algorithms, long-running synchronous operations, or memory leaks within the application code can cause workers to take an excessively long time to process tasks, leading to a build-up in the queue.
- Resource Exhaustion (System-Wide Bottlenecks): Beyond individual worker slowness, the underlying system resources supporting the workers might be exhausted. This includes:
- CPU Starvation: The system CPU is completely saturated, preventing workers from executing their code.
- Memory Exhaustion: The system runs out of RAM, leading to swapping (using disk as virtual memory, which is much slower) or processes being killed.
- Disk I/O Bottlenecks: If tasks involve heavy disk reads or writes, a slow or overloaded disk subsystem can bring processing to a crawl.
- Network Saturation: The network interface or network path itself becomes saturated, slowing down communication with backend services or even preventing new requests from reaching the gateway.
- Misconfiguration: Sometimes, the problem isn't inherent resource limits but simply incorrect settings.
- Queue Size Limits: The maximum queue size might be set too low for the expected workload, causing it to fill up prematurely.
- Thread Pool Settings: The number of worker threads might be too small, or their lifecycle management might be misconfigured, preventing new threads from being spawned when needed.
- Timeouts: Aggressive timeouts on upstream services can cause workers to fail prematurely, leaving tasks in a partially processed state or contributing to errors, though not directly a "queue full" issue, they can exacerbate system instability.
Impact of a Full Queue
The consequences of a "Works Queue Full" error are severe and can cascade throughout your system:
- Increased Latency: Even before the queue is completely full, a growing queue length indicates that requests are waiting longer for processing, leading to higher response times for users.
- Failed Requests: Once the queue is full, new requests are rejected, leading to error messages for clients and a degraded user experience. This directly impacts service availability.
- Service Unavailability: If the problem persists or affects critical components, entire services can become unavailable.
- Cascading Failures: A full queue in one service can lead to timeouts and full queues in dependent upstream services, creating a chain reaction that brings down multiple parts of an application. For instance, an overwhelmed backend service could cause the api gateway to queue requests until its own queue fills up.
- Loss of Data/Transactions: In systems where tasks represent critical transactions (e.g., payment processing), a full queue can mean lost transactions, leading to financial impact or data inconsistency.
The "Works Queue Full" error is a crucial indicator of system stress. It highlights where the system's ability to cope with demand is breaking down, offering a critical opportunity for diagnosis and remediation. Whether it's a general gateway component, a specialized AI Gateway, or a backend microservice, understanding this error is fundamental to maintaining robust and performant applications.
Common Scenarios Leading to "Works Queue Full"
Understanding the theoretical underpinnings of "Works Queue Full" is one thing; recognizing the practical scenarios that trigger it is another. These situations often involve a confluence of factors, making diagnosis a nuanced process.
1. Traffic Spikes and Unexpected Load
This is perhaps the most obvious and frequently encountered scenario. Modern applications often experience highly variable traffic patterns.
- Flash Sales and Marketing Campaigns: E-commerce platforms, for instance, might launch a highly anticipated product or a limited-time sale. The immediate surge in user activity—hundreds of thousands or even millions of concurrent requests—can quickly overwhelm an unprepared system. Users simultaneously refreshing product pages, adding items to carts, and attempting checkout flood the system.
- DDoS Attacks or Malicious Traffic: While distinct from legitimate load, distributed denial-of-service (DDoS) attacks aim to overwhelm a target system with massive amounts of traffic, leading to resource exhaustion, including full work queues. Similarly, poorly written bots or scrapers can generate non-stop requests that mimic a legitimate traffic spike.
- Viral Events and Sudden Popularity: A news story breaking, a social media post going viral, or a new feature attracting unexpected attention can suddenly drive millions of users to an application. If the system's autoscaling mechanisms aren't fast enough or if there are hard capacity limits, queues will quickly fill up.
- Batch Processing Overlap: Sometimes, internal batch jobs, data migrations, or reporting tasks that normally run during off-peak hours might accidentally overlap with peak user traffic, collectively pushing the system beyond its limits.
- External System Outages/Recovery: If an external dependency (like a payment gateway or a third-party authentication service) goes down and then recovers, the sudden flood of retry requests from your system and its users can create a "thundering herd" effect, overwhelming your internal queues.
In these scenarios, the api gateway is on the front lines, accepting all incoming traffic. If it's not robustly designed or configured, its own work queues can become full, rejecting requests before they even reach the backend services, leading to a complete service outage.
2. Backend Service Slowdowns or Failures
Often, the problem isn't the direct incoming traffic volume, but rather the inability of downstream services to keep up.
- Database Bottlenecks: This is a classic culprit. Slow queries, missing indexes, deadlocks, insufficient database connection pool size, or an overloaded database server (due to high CPU, memory, or disk I/O) will cause application workers to wait indefinitely for database responses. As workers are blocked, they cannot process new tasks from their queue, leading to a backlog.
- External API Dependencies: Many applications rely on third-party APIs for functionalities like payment processing, identity verification, or mapping services. If these external APIs experience latency or downtime, your application's workers making calls to them will become blocked.
- Microservice Interdependencies: In a microservices architecture, a single request might traverse multiple services. If one microservice in the chain becomes slow or unresponsive, it can cause a cascading effect where upstream services (including the api gateway) accumulate pending requests in their queues while waiting for a response.
- Long-Running Business Logic: Some application tasks inherently require more processing time—complex calculations, large file processing, image manipulation. If a sudden increase in these types of requests occurs, or if existing logic becomes inefficient, workers will remain occupied for extended periods, reducing the available capacity for new tasks.
- Memory Leaks or Garbage Collection Issues: Bugs in application code can lead to memory leaks, causing the application process to consume more and more memory. Eventually, this can trigger aggressive garbage collection (GC) cycles, which pause application execution for significant periods, effectively "freezing" workers and causing queues to build up.
When backend services are slow, the gateway might continue to accept requests, but the actual processing stalls further down the line. The gateway's internal queues, designed to buffer requests while waiting for backend availability, will eventually fill up. This is particularly relevant for an AI Gateway which might be orchestrating calls to multiple AI models, where one slow or complex model inference could hold up many worker threads.
3. Resource Exhaustion at the System Level
Beyond application-specific issues, fundamental infrastructure limitations can cause queues to fill.
- CPU Starvation: When the CPU utilization reaches 100% across all cores, there are simply no more processing cycles available for workers to execute their tasks. This often happens in conjunction with high traffic or inefficient code.
- Memory Exhaustion: Running out of available RAM forces the operating system to start using swap space (disk) as virtual memory. Disk I/O is orders of magnitude slower than RAM, leading to massive performance degradation and workers getting stuck waiting for memory access. In severe cases, the OS might kill processes to free up memory.
- Disk I/O Bottlenecks: For applications that heavily read from or write to disk (e.g., logging, file storage, database replication logs), a saturated disk subsystem can become a major bottleneck. Workers waiting for disk operations will become blocked.
- Network Saturation: While less common than CPU/memory issues for internal queues, the network interface card (NIC) or the network path between components can become saturated. If the api gateway's network connection to its backend services is maxed out, it cannot send requests or receive responses efficiently, leading to internal queue buildup.
- File Descriptor Limits: Linux systems have limits on the number of open file descriptors (which include network sockets). If an application, especially a high-concurrency one or a gateway, opens too many connections or files without closing them, it can hit this limit, preventing it from establishing new connections or handling new requests.
These system-level issues can affect any component, including the api gateway itself, causing its internal work queues to overflow.
4. Misconfiguration
Sometimes, the root cause is not an overload but simply an incorrect setting that artificially constrains the system.
- Insufficient Queue Sizes: The most direct form of misconfiguration. If the queue size (e.g., connection backlog, thread pool queue size) is set too low relative to the expected transient load, even moderate spikes can trigger "Works Queue Full" errors. This is a common oversight during initial deployment or when moving to a higher traffic environment.
- Limited Thread Pool or Worker Process Count: If the number of worker threads or processes configured for an application server, web server, or gateway is too small, it cannot handle the incoming concurrency even if CPU and memory are available. This directly impacts the rate at which tasks are pulled from the queue.
- Aggressive Timeouts: While important for preventing indefinite waits, overly aggressive timeouts can cause requests to fail prematurely, especially under load. This might not directly cause "queue full" but can lead to retries that exacerbate an already stressed system, or contribute to scenarios where a gateway incorrectly assumes a backend is unresponsive.
- Improper Load Balancer Settings: If the load balancer upstream of your services (or the api gateway) is not configured to distribute traffic evenly, or if its health checks are too slow to react to failing instances, it can funnel too much traffic to a single instance, overwhelming its queues.
- TCP/IP Stack Configuration: Low-level network parameters like
net.core.somaxconn(max backlog for listen sockets) ornet.ipv4.tcp_max_syn_backlogcan limit the number of pending connections, effectively acting as a "queue" at the kernel level before requests even reach the application layer.
A seemingly minor misconfiguration in an api gateway or an AI Gateway that handles many concurrent connections can have a disproportionate impact, leading to premature queue exhaustion.
5. Inefficient Code or Application Logic
Finally, the design and implementation of the application itself can be a major contributor.
- Synchronous Blocking Operations: Code that performs long-running I/O operations (like database calls, file system access, or external API calls) synchronously will block the executing thread. If many threads are blocked, the thread pool capacity is quickly consumed, leading to queue buildup.
- Unoptimized Queries or Algorithms: Inefficient database queries that scan large tables without indexes, or algorithms with high time complexity, can drastically increase the processing time per request.
- Lack of Caching: Repeatedly fetching the same data from a database or external service instead of caching it increases load on backend systems and keeps workers busy unnecessarily.
- Memory Leaks/Excessive Object Creation: As mentioned, these can lead to frequent and long garbage collection pauses.
- Poorly Designed Concurrency Control: Inadequate or incorrect use of locks, semaphores, or other concurrency primitives can lead to contention, deadlocks, or inefficient utilization of worker threads.
These code-level issues reduce the overall throughput of the system, making it appear as though there's an "overload" when in reality, the workers are simply not processing tasks fast enough. This is particularly relevant in the context of an AI Gateway where complex model inference or data preprocessing might be involved. If the AI model or its surrounding logic is inefficient, it can quickly saturate the AI Gateway's worker pool.
Understanding these varied scenarios is the first step towards an effective troubleshooting strategy. The next step is to leverage powerful diagnostic tools to pinpoint the exact bottleneck.
Diagnosing the "Works Queue Full" Error: A Systematic Approach
When the "Works Queue Full" error strikes, a methodical approach to diagnosis is paramount. Haphazard adjustments without understanding the root cause can exacerbate the problem or introduce new ones. The key is to gather comprehensive data, correlate observations, and systematically narrow down the potential bottlenecks. Observability, comprising monitoring, logging, and tracing, forms the bedrock of this diagnostic process.
1. Monitoring Tools: The Eyes and Ears of Your System
Effective monitoring provides real-time and historical insights into your system's health and performance. This is where you first notice that something is wrong and where you start to gather clues.
- Queue Depth Metrics: This is the most direct indicator. Monitor the actual size or depth of the "works queue" that is reporting full. Many application servers, message brokers, and even operating systems expose this metric. A steadily increasing queue depth, especially one approaching its configured maximum, is a clear warning sign. For an api gateway, metrics around pending requests or connection backlogs are crucial.
- Resource Utilization Metrics:
- CPU Utilization: High CPU usage (consistently above 80-90% for sustained periods) often indicates CPU starvation, where workers are waiting for processing time. Track both system and user CPU.
- Memory Usage: Monitor RAM usage (resident set size, virtual memory). A continuously growing memory footprint, especially without corresponding load increases, could signal a memory leak. Also, monitor swap space usage; any significant swap activity is a critical performance killer.
- Disk I/O: Track read/write operations per second (IOPS), throughput (MB/s), and I/O wait times. High I/O wait often indicates a bottleneck at the storage level.
- Network I/O: Monitor network bandwidth (bytes in/out) and packet rates. Look for signs of network saturation on network interfaces, especially those connecting the gateway to backend services or clients.
- Application-Specific Metrics:
- Request Latency/Response Times: Track end-to-end latency and latency breakdown at different stages (e.g., gateway processing time, backend service processing time, database query time). Spikes in latency often precede queue saturation.
- Error Rates: An increase in 5xx HTTP status codes (especially 503 Service Unavailable or 504 Gateway Timeout) directly correlates with requests being rejected due to queue fullness or backend unresponsiveness.
- Thread Pool Statistics: For applications using thread pools (common in Java, .NET, Node.js), monitor the number of active threads, idle threads, and the size of the thread pool queue. If active threads are consistently at their maximum and the queue is growing, it's a strong indicator of worker saturation.
- Database Connection Pool Metrics: Monitor the number of active, idle, and waiting connections in your database connection pools. A full connection pool will block application workers.
- Gateway Specific Metrics: For an api gateway, metrics like current open connections, requests in flight, upstream connection pool health, and health checks results for backend services are vital. An AI Gateway would also benefit from specific metrics related to AI model inference times, queue lengths for model invocations, and GPU utilization if applicable.
Tools like Prometheus, Grafana, Datadog, New Relic, or even cloud-native monitoring solutions (AWS CloudWatch, Azure Monitor, Google Cloud Monitoring) are indispensable for collecting, visualizing, and alerting on these metrics.
2. Logs: The Detailed Narrative of Events
While metrics tell you "what" is happening, logs tell you "why" it's happening. When a "Works Queue Full" error occurs, logs become your forensic tool.
- Application Logs: Look for specific error messages related to queue overruns, thread pool exhaustion, or specific exceptions that occur when the system cannot accept new tasks. Also, check for any warning or error messages that immediately precede the "queue full" error, which might indicate the root cause (e.g., database connection errors, external API timeouts, long-running task warnings).
- Server Logs (OS and Web Server):
- Kernel Logs (e.g.,
dmesgon Linux): Check for out-of-memory (OOM) killer messages, disk errors, or network interface issues. - Web Server Logs (e.g., Nginx, Apache): These logs, especially error logs, will often show 503 or 504 errors generated by the web server when it cannot forward requests to an overloaded application server, or when its own upstream queues are full.
- API Gateway Logs: The logs from your api gateway (e.g., Envoy, Kong, Nginx configured as a reverse proxy, or APIPark) are critical. They will record rejected requests, timeouts when trying to connect to backend services, and potentially specific messages indicating its internal queues are full. These logs can help determine if the gateway itself is the bottleneck or if it's simply reflecting an issue in the backend.
- Kernel Logs (e.g.,
- Database Logs: Examine database error logs, slow query logs, and transaction logs. These can pinpoint specific queries or operations that are consuming excessive resources or taking too long.
- Distributed Logging Systems: Tools like ELK Stack (Elasticsearch, Logstash, Kibana), Splunk, or Sumo Logic are invaluable for centralizing logs from all services. This allows for quick searching, filtering, and correlation of log events across your entire distributed system, which is crucial for identifying cascading failures.
Always correlate log entries with timestamps to match them against metric spikes.
3. Tracing: Following the Path of a Request
In a microservices architecture, a single user request can traverse many services. Distributed tracing allows you to visualize the entire path of a request and measure the time spent at each hop.
- Identifying Bottlenecks: Tracing tools (e.g., Jaeger, Zipkin, OpenTelemetry) can pinpoint exactly which service or even which specific function call within a service is contributing the most latency. If a significant portion of the request's total time is spent waiting on a particular service or database, that's a prime candidate for investigation.
- Service Dependency Mapping: Tracing helps you understand the dependencies between services, which is crucial for identifying cascading effects. If Service A's queue is full, tracing might reveal that Service A is waiting indefinitely for Service B, which is itself struggling.
Tracing complements monitoring and logging by providing a granular, end-to-end view of individual request lifecycles.
4. Identifying the Bottleneck: Asking the Right Questions
Once you have gathered data from monitoring, logs, and tracing, you need to synthesize this information to pinpoint the bottleneck. Ask yourself:
- Is the gateway itself overloaded? Check api gateway CPU, memory, network, and its own internal queue metrics. Are its logs showing internal queue full messages? If it's an AI Gateway, is the specific AI inference process saturating its resources?
- Is a specific backend service slow or failing? Look at the metrics and logs for individual microservices or monolithic applications. Is their CPU high? Are their database calls slow? Are they logging errors?
- Is the database the bottleneck? Check database server metrics (CPU, memory, disk I/O, active connections, query duration) and logs (slow query logs, error logs).
- Are external dependencies causing delays? Monitor calls to third-party APIs.
- Is it a resource issue or a configuration issue? Are CPU, memory, or network maxed out, or is a specific queue/thread pool limit being hit prematurely while other resources are ample?
5. Load Testing and Stress Testing
While reactive diagnosis is essential, proactive testing is invaluable for preventing "Works Queue Full" errors.
- Replicating the Issue: If the error occurs in production, try to reproduce it in a staging or testing environment using load testing tools (e.g., JMeter, Locust, k6). This allows you to experiment with fixes without impacting live users.
- Capacity Planning: Load testing helps determine the maximum load your system can handle before performance degrades or queues start to fill. This information is crucial for informed capacity planning and autoscaling strategies.
- Identifying Breaking Points: Stress testing pushes the system beyond its limits to find its breaking points and understand how it behaves under extreme load. This can reveal unexpected bottlenecks and resilience weaknesses.
6. Profiling (for Code-Level Issues)
If monitoring and tracing point to a specific application service or a long-running function within an application as the bottleneck, profiling tools (e.g., JProfiler, VisualVM for Java; gprof for C++; pprof for Go) can help.
- CPU Profiling: Identifies which parts of the code are consuming the most CPU time.
- Memory Profiling: Helps detect memory leaks and inefficient memory usage.
- Thread Analysis: Shows thread states (running, waiting, blocked) and contention points.
By systematically applying these diagnostic techniques, you can move beyond guesswork and pinpoint the precise cause of a "Works Queue Full" error, laying the groundwork for effective resolution.
APIPark is a high-performance AI gateway that allows you to securely access the most comprehensive LLM APIs globally on the APIPark platform, including OpenAI, Anthropic, Mistral, Llama2, Google Gemini, and more.Try APIPark now! 👇👇👇
Troubleshooting and Solutions: Strategies for Resolution
Once the root cause of the "Works Queue Full" error has been identified, the next critical step is to implement effective solutions. These solutions can generally be categorized into short-term fixes for immediate relief and long-term strategies for sustainable stability and resilience.
Short-Term Fixes (Immediate Relief)
When your system is actively experiencing "Works Queue Full" errors, the priority is to alleviate the pressure and restore service as quickly as possible. These fixes often provide temporary respite but may not address the underlying architectural or code inefficiencies.
- Increase Queue/Thread Pool Sizes (with caution):
- Action: Incrementally increase the configured maximum size of the affected queue or the number of worker threads in a thread pool. For example, in a Java application, you might adjust the
max-threadsin a web server configuration or the capacity of aBlockingQueue. For a Linux system, you might temporarily increasenet.core.somaxconnfor socket listen backlogs. - Rationale: This buys you more buffer space and allows the system to absorb a larger burst of traffic or tolerate slightly slower processing for a short period.
- Caution: This is a band-aid solution. If the underlying processing capacity hasn't increased, merely extending the queue length only postpones the inevitable and can lead to higher latency for requests stuck at the end of a longer queue. It can also mask resource exhaustion; an excessively large queue might consume too much memory, leading to other system issues. Always monitor resource utilization carefully after making such changes.
- Action: Incrementally increase the configured maximum size of the affected queue or the number of worker threads in a thread pool. For example, in a Java application, you might adjust the
- Rate Limiting:
- Action: Implement a mechanism to restrict the number of requests a client or a group of clients can make within a specific time frame. This is typically done at the api gateway or load balancer level. For an AI Gateway, this might involve limiting the number of AI inference requests per user or per minute.
- Rationale: Rate limiting prevents any single client or sudden surge of traffic from overwhelming your backend services and filling up your queues. It acts as a protective shield, ensuring fair usage and preserving system stability for legitimate traffic.
- Implementation: Many api gateway products, including APIPark, offer robust rate-limiting capabilities that can be configured per API, per user, or based on other criteria. This allows you to define policies like "max 100 requests per minute per IP address."
- Circuit Breakers:
- Action: Implement circuit breaker patterns around calls to potentially failing or slow backend services. A circuit breaker monitors the success/failure rate of calls to a dependency. If failures exceed a threshold, it "trips" (opens the circuit), preventing further calls to that service for a period. Instead, it fails fast, returning an immediate error or a fallback response.
- Rationale: This prevents cascading failures. If a backend service is already struggling and its queue is full, continuing to send it requests only exacerbates its problems and causes your upstream services (including the api gateway) to block and accumulate requests in their own queues. By breaking the circuit, you allow the struggling service to recover without additional load, and your system can fail gracefully for the affected dependency.
- Implementation: Circuit breakers are typically implemented at the client-side of a service call or within an intelligent api gateway that orchestrates inter-service communication.
- Throttling/Backpressure Mechanisms:
- Action: Implement mechanisms that signal to upstream components (clients or other services) to temporarily reduce their request rate. This is a form of proactive communication. For example, your gateway could return a 429 Too Many Requests HTTP status code with a
Retry-Afterheader, indicating that the client should back off and try again later. - Rationale: Unlike rate limiting (which enforces a hard cap), throttling is a dynamic response to current system load. It allows the system to absorb traffic up to a certain point, then gracefully degrade by telling clients to slow down before critical queues become full.
- Implementation: This often requires cooperation from clients to respect the
Retry-Afterheaders. An api gateway can be configured to dynamically throttle requests based on its own health and the health of its upstream services.
- Action: Implement mechanisms that signal to upstream components (clients or other services) to temporarily reduce their request rate. This is a form of proactive communication. For example, your gateway could return a 429 Too Many Requests HTTP status code with a
- Horizontal Scaling:
- Action: Add more instances (servers, containers, pods) of the affected service or the api gateway itself. This distributes the incoming load across more processing units.
- Rationale: This directly increases the total processing capacity and the aggregate queue capacity of your system. If a single instance's queue is full, adding more instances means requests can be routed to less burdened ones.
- Implementation: This relies on having a load balancer in front of your service instances. Cloud environments offer auto-scaling groups that can dynamically add or remove instances based on predefined metrics (e.g., CPU utilization, queue depth). For an AI Gateway, this could mean deploying more instances of the gateway or specific AI model inference servers.
Long-Term Solutions (Sustainable Stability)
While short-term fixes are crucial for immediate incident response, sustainable stability requires addressing the underlying architectural, design, and code-level issues.
- Optimize Backend Services:
- Code Optimization: Review and refactor inefficient code paths.
- Algorithms: Replace inefficient algorithms with more performant ones (e.g., O(n^2) to O(n log n)).
- Asynchronous Processing: Convert blocking synchronous I/O operations (database calls, external API calls) to non-blocking asynchronous calls. This frees up worker threads to process new requests while waiting for I/O to complete, dramatically improving concurrency. Node.js and modern Java (Project Loom/virtual threads), Go, and Python frameworks excel at this.
- Caching: Implement robust caching strategies at various levels: in-memory caches, distributed caches (Redis, Memcached), and HTTP caching at the gateway level. Cache frequently accessed data to reduce load on backend services and databases.
- Database Optimization:
- Indexing: Ensure appropriate indexes are in place for frequently queried columns to speed up query execution.
- Query Tuning: Analyze and optimize slow database queries. This might involve rewriting queries, splitting complex queries, or using query hints.
- Connection Pooling: Configure database connection pools with optimal min/max sizes and appropriate timeouts to manage database connections efficiently.
- Database Scaling: Consider horizontal scaling for databases (read replicas, sharding) or vertical scaling (more powerful server) if the database itself is the bottleneck.
- Resource Provisioning: Ensure that backend servers have adequate CPU, memory, and disk I/O capacity for their expected load. Regularly review and adjust resource allocations based on monitoring data and future growth projections.
- Code Optimization: Review and refactor inefficient code paths.
- Refine API Gateway Configuration:
- Optimal Thread Pool Settings: Tune the api gateway's internal worker thread pool and connection pool sizes. Too few threads can cause a bottleneck; too many can lead to excessive context switching overhead or resource exhaustion.
- Connection Timeouts: Configure appropriate connection, read, and write timeouts for upstream services. This prevents the gateway from holding onto resources indefinitely while waiting for an unresponsive backend.
- Load Balancing Strategies: Configure intelligent load balancing algorithms (e.g., least connections, weighted round-robin) to distribute traffic most effectively among backend instances.
- Health Checks: Implement robust and frequent health checks for backend services within the api gateway. This ensures traffic is only routed to healthy instances, preventing requests from piling up in queues destined for failing services.
- Specific Features for AI Gateway: For an AI Gateway like APIPark, leverage its specialized features. For instance, APIPark's ability to quickly integrate 100+ AI models and provide a unified API format means the gateway itself is optimized for handling diverse AI workloads. Its high performance (20,000+ TPS) and cluster deployment support are crucial for managing large-scale AI inference requests without queue saturation. The detailed logging and data analysis features in ApiPark are invaluable for proactively identifying AI model performance bottlenecks before they lead to "Works Queue Full" errors.
- Implement Robust Caching:
- Caching is so important it deserves its own mention. Beyond application-level caching, an api gateway can implement HTTP caching for responses, significantly reducing the load on backend services for frequently accessed, non-dynamic content. This can drastically lower the number of requests that need to hit application queues.
- Asynchronous Processing / Message Queues:
- Action: Decouple components that perform long-running or non-real-time operations using message queues (e.g., Kafka, RabbitMQ, SQS). Instead of directly invoking a slow operation, your application or api gateway places a message onto a queue, and a separate worker process consumes these messages asynchronously.
- Rationale: This protects the main request-response path from being blocked by slow operations. The front-end application can quickly return a response (e.g., "request accepted, processing in background") while the work is done later. This dramatically improves the responsiveness and scalability of the interactive parts of your system and prevents queues from filling up with long-running tasks.
- Example: For an AI Gateway processing complex AI models, a request might involve uploading an image for analysis. Instead of processing the image synchronously, the AI Gateway could place a task on a message queue, and a separate service dedicated to image processing and AI inference would pick it up.
- Implement Autoscaling:
- Action: Configure your infrastructure (virtual machines, containers, database replicas) to automatically scale up (add resources) or scale down (remove resources) based on predefined metrics such as CPU utilization, request queue depth, network traffic, or custom application metrics.
- Rationale: Autoscaling dynamically adjusts your system's capacity to match demand, preventing overload during traffic spikes and optimizing costs during periods of low activity. This is one of the most effective ways to prevent "Works Queue Full" errors caused by unexpected load.
- Implementation: Cloud providers offer robust autoscaling features. Kubernetes also provides Horizontal Pod Autoscalers (HPA) and Cluster Autoscalers.
- Capacity Planning:
- Action: Regularly review historical performance data, forecast future growth, and proactively plan for infrastructure scaling. This involves understanding your system's breaking points through load testing and ensuring that resource provisioning is always ahead of demand.
- Rationale: Reactive scaling is often too late for sudden spikes. Proactive capacity planning minimizes surprises and ensures that your system can handle anticipated growth without performance degradation.
- Microservices Architecture Considerations:
- Design for Resilience: Ensure individual microservices are designed with fault tolerance in mind. Use patterns like bulkheads, retries with exponential backoff, and circuit breakers.
- Independent Scaling: Design services to scale independently. A bottleneck in one service should not prevent others from scaling to meet demand.
- Loose Coupling: Reduce tight dependencies between services to minimize cascading failures.
Summary of Solutions
| Solution Category | Short-Term Fix (Immediate Relief) | Long-Term Solution (Sustainable Stability) |
|---|---|---|
| Capacity Management | Increase Queue/Thread Pool Sizes (cautious) | Horizontal Scaling, Autoscaling, Capacity Planning |
| Traffic Control | Rate Limiting, Throttling/Backpressure | Optimize Backend Services (efficient code, database), Robust Caching |
| Resilience Patterns | Circuit Breakers | Asynchronous Processing/Message Queues, Microservices Design for Resilience |
| Configuration | Adjust Gateway/Server Settings | Refine API Gateway Configuration (timeouts, load balancing, health checks) |
| Proactive Measures | Performance Testing (Load/Stress), Code Profiling, Regular System Audits |
By combining immediate tactical responses with strategic long-term architectural improvements, you can effectively resolve "Works Queue Full" errors and build highly resilient, performant, and scalable systems. The choice of an appropriate api gateway, especially an advanced one like an AI Gateway such as APIPark, can significantly contribute to both aspects of this solution strategy by providing robust traffic management, monitoring, and performance capabilities.
The Role of an API Gateway and AI Gateway in Preventing and Managing "Works Queue Full"
In the complex landscape of modern distributed systems, the api gateway stands as a critical traffic cop, the first line of defense, and a central point of control for all incoming requests. Its role in preventing and managing "Works Queue Full" errors is multifaceted and absolutely pivotal. For systems that integrate artificial intelligence, a specialized AI Gateway extends these capabilities to the unique demands of AI model management and inference.
Centralized Traffic Management: The First Line of Defense
An api gateway acts as a single entry point for all API requests, routing them to the appropriate backend services. This centralization offers immense control over traffic flow.
- Request Interception and Routing: The gateway intercepts every request, making it an ideal place to apply policies before requests even hit backend service queues. If the gateway itself is configured robustly, it can absorb initial spikes and route traffic intelligently, preventing downstream services from being overwhelmed.
- Decoupling Clients from Services: By abstracting the backend service topology, the gateway allows for seamless scaling and updates of individual services without impacting clients. This means services can be taken offline for maintenance, scaled up/down, or even have their internal queues full without the client immediately experiencing errors, provided the gateway can handle it gracefully.
Rate Limiting and Throttling: Guarding Against Overload
These are perhaps the most direct mechanisms an api gateway employs to prevent "Works Queue Full" errors.
- Preventing Abuse and Overload: The gateway can enforce quotas on the number of requests per client, per API, or globally. If a client exceeds their limit, the gateway rejects the request with a 429 status code, rather than forwarding it to a backend service that might then experience a queue overload. This protects both individual services and the gateway itself from being saturated by malicious attacks or even well-intentioned but overly aggressive clients.
- Fair Resource Distribution: Rate limiting ensures that no single client or application can monopolize resources, allowing for a more equitable distribution of processing capacity among all consumers of your APIs.
Circuit Breaking: Containing Cascading Failures
The api gateway is an ideal place to implement circuit breaker patterns, especially for calls to backend services that are prone to latency or failures.
- Isolating Unhealthy Services: If a backend service becomes slow or unresponsive (perhaps its own internal queue is full), the gateway can detect this through health checks and failed request patterns. A configured circuit breaker in the gateway will then "open," meaning it will stop sending requests to that unhealthy service for a defined period.
- Fail-Fast Mechanism: Instead of requests accumulating in the gateway's queue while waiting for a timed-out backend, the circuit breaker allows the gateway to immediately return an error or a fallback response to the client. This prevents the gateway's own queues from filling up and allows the unhealthy service time to recover without additional load.
Load Balancing: Distributing Requests Efficiently
A core function of an api gateway is to distribute incoming requests across multiple instances of a backend service.
- Optimizing Resource Utilization: By employing intelligent load balancing algorithms (e.g., least connections, round-robin, weighted average), the gateway ensures that traffic is spread evenly, or directed to the least busy instances. This prevents any single service instance from becoming a hot spot and having its work queue fill up while other instances remain underutilized.
- High Availability: In conjunction with health checks, load balancing also contributes to high availability. If an instance fails or becomes unresponsive, the gateway can automatically cease sending traffic to it and redirect requests to healthy instances, maintaining service continuity and preventing queues from building up for non-existent or struggling workers.
Monitoring and Analytics: Providing Crucial Insights
A good api gateway is a rich source of operational data.
- Centralized Observability: It can collect metrics on request volumes, latency, error rates, and resource utilization for all incoming and outgoing API calls. This data is invaluable for detecting performance degradation, identifying traffic spikes, and pinpointing potential bottlenecks that could lead to "Works Queue Full" errors.
- Detailed Logging: Gateway logs provide a comprehensive record of every request, including its origin, destination, response status, and duration. This detailed information is critical for post-mortem analysis and troubleshooting when "Works Queue Full" errors occur, allowing engineers to trace the exact sequence of events leading to the issue.
The Special Case of an AI Gateway: Managing Unique Workloads
An AI Gateway builds upon the foundational capabilities of a standard api gateway but is specifically tailored for the demands of integrating and managing AI models. This specialization is crucial for preventing "Works Queue Full" errors in AI-driven applications.
Consider the product APIPark - Open Source AI Gateway & API Management Platform, which exemplifies these specialized capabilities. APIPark acts as an AI Gateway and an api gateway rolled into one. Here's how its features are directly relevant to preventing and managing "Works Queue Full" errors:
- Quick Integration of 100+ AI Models & Unified API Format: AI models, especially large language models or complex vision models, can be resource-intensive and have varying latency characteristics. If not managed well, invoking many different models directly can quickly overwhelm backend services or the application's own queue. APIPark simplifies this by providing a unified API format, abstracting away the complexity. This means applications interact with a standardized interface, allowing APIPark to efficiently manage the underlying model invocations. This standardization, coupled with efficient routing, prevents application-level queues from getting tied up with complex model-specific logic or variations.
- Prompt Encapsulation into REST API: By allowing users to combine AI models with custom prompts into new APIs (e.g., a sentiment analysis API), APIPark shifts the complexity of prompt engineering and model invocation to the gateway. This offloads processing from individual application instances, centralizing it within the high-performance AI Gateway. If this encapsulation is efficient, it means less work for downstream services, reducing their queue burden.
- Performance Rivaling Nginx: With just an 8-core CPU and 8GB of memory, APIPark can achieve over 20,000 TPS and supports cluster deployment. This high throughput is critical. A "Works Queue Full" error often indicates a bottleneck in processing speed. An AI Gateway with high TPS (transactions per second) capability means it can handle a massive volume of AI inference requests without its internal queues filling up, even during peak loads. Its cluster deployment support allows for horizontal scaling, directly addressing the need to increase capacity when traffic spikes occur, thereby preventing queue saturation across the gateway layer.
- Detailed API Call Logging & Powerful Data Analysis: APIPark provides comprehensive logging, recording every detail of each API call. This is invaluable for diagnosing "Works Queue Full" errors. When such an error occurs, these logs allow businesses to quickly trace and troubleshoot issues, identifying which API calls or AI model invocations might be taking too long or failing. Furthermore, APIPark analyzes historical call data to display long-term trends and performance changes. This proactive data analysis helps businesses identify potential bottlenecks before they manifest as critical "Works Queue Full" errors. For instance, if the average inference time for a specific AI model is steadily increasing, APIPark's analysis can highlight this, enabling preventive maintenance before the AI Gateway's queues become saturated.
- End-to-End API Lifecycle Management: By assisting with managing the entire lifecycle of APIs, including design, publication, invocation, and decommissioning, APIPark helps regulate API management processes. This includes managing traffic forwarding, load balancing, and versioning of published APIs. These features are all geared towards ensuring efficient and controlled API access, which directly contributes to preventing overwhelming individual services or the gateway itself.
- API Service Sharing within Teams & Independent API and Access Permissions: While not directly preventing queue overloads, these features promote organized and secure API consumption. Well-managed access and clear service sharing reduce ad-hoc or poorly optimized API calls that might inadvertently create load spikes.
In essence, a well-implemented api gateway, and particularly an AI Gateway like ApiPark, serves as an intelligent traffic manager that not only routes requests but also protects backend services, enhances resilience, and provides the observability tools necessary to prevent, detect, and resolve "Works Queue Full" errors. Its centralized control, combined with specialized features for AI workloads, makes it an indispensable component in building scalable and stable modern applications.
Best Practices for High-Performance and Resilient Systems
Preventing "Works Queue Full" errors is not just about reactive troubleshooting; it’s about architecting and operating systems with resilience and performance at their core. Embracing a set of best practices can significantly reduce the likelihood of these dreaded errors and ensure your applications remain stable and responsive even under stress.
1. Observability First: Integrate Monitoring, Logging, and Tracing from Day One
The ability to see what's happening inside your system is not an optional add-on; it's a fundamental requirement.
- Comprehensive Metrics: Instrument every service and infrastructure component (CPU, memory, disk, network, queue depths, thread pool sizes, request rates, error rates, latency percentiles). Use consistent metric naming conventions.
- Structured Logging: Ensure all applications log relevant information in a structured, machine-readable format (e.g., JSON). Include correlation IDs (like request IDs) to link logs across services. Centralize logs for easy searching and analysis.
- Distributed Tracing: Implement distributed tracing across your microservices architecture. This provides an end-to-end view of request flows, making it easy to identify latency bottlenecks and service dependencies.
- Alerting: Configure meaningful alerts based on thresholds for key metrics. Don't just alert on critical failures; set up warning alerts for metrics like increasing queue depths, rising latency, or backend service error rates that might precede a full queue.
- Dashboards: Create intuitive dashboards that visualize your system's health, performance, and key business metrics. These allow for quick status checks and facilitate root cause analysis during incidents.
By making observability a first-class citizen, you move from guessing to knowing, allowing for proactive intervention before queues become full.
2. Design for Failure: Assume Components Will Fail
In a distributed system, failures are inevitable, not exceptional. Your system should be designed to gracefully handle failures of individual components without suffering a complete outage.
- Redundancy: Deploy critical services in redundant configurations (e.g., multiple instances across different availability zones, database replicas).
- Isolation (Bulkheads): Isolate components to prevent failures from cascading. If one part of your system (e.g., a specific API endpoint or a complex AI model managed by an AI Gateway) is experiencing issues, it should not bring down the entire application. Use separate thread pools, connection pools, or even separate clusters for different functionalities.
- Graceful Degradation: If a non-essential service or dependency fails, the system should ideally continue to function with reduced functionality rather than completely failing. For example, if a recommendation engine (often an AI-driven service) is slow, the application might still show products but without personalized recommendations, returning a default list instead.
- Idempotency and Retries: Design API operations to be idempotent where possible, allowing clients to safely retry requests without adverse side effects. Implement intelligent retry mechanisms with exponential backoff and jitter to avoid overwhelming a recovering service.
- Timeouts: Configure sensible timeouts for all network operations and inter-service communications. This prevents threads from blocking indefinitely, thereby freeing up resources faster. This is crucial for an api gateway making calls to various backend services.
3. Implement Backpressure and Throttling Mechanisms
Proactive measures to manage demand are crucial for system stability.
- Rate Limiting at the Edge: Implement robust rate limiting at your api gateway to protect your entire infrastructure from excessive requests, whether malicious or accidental.
- Dynamic Throttling: Design services to communicate their load status to upstream callers. If a service is nearing its capacity or its queues are starting to fill, it can signal upstream services to reduce their request rate (e.g., by returning 429 HTTP status codes with
Retry-Afterheaders). - Asynchronous Queues: For non-real-time or background tasks, use message queues. This decouples producers from consumers, allowing services to absorb bursts of work and process them at their own pace, preventing direct queue overloads on synchronous request paths.
4. Optimize Performance Relentlessly
Continuous performance optimization is a journey, not a destination.
- Code Efficiency: Regularly review and optimize application code for CPU, memory, and I/O efficiency. Use profiling tools to identify and eliminate performance bottlenecks.
- Caching Strategies: Implement comprehensive caching at all appropriate layers (CDN, api gateway, in-memory, distributed cache, database query cache) to reduce load on backend services and databases.
- Database Performance: Ensure database queries are optimized, indexes are utilized, and database server resources are adequate.
- Resource Provisioning: Continuously monitor resource utilization (CPU, memory, disk, network) and scale up or out proactively based on observed trends and anticipated growth. Utilize autoscaling features in cloud environments.
- Efficient Data Serialization: Choose efficient data formats (e.g., Protobuf, Avro) and serialization libraries to minimize network bandwidth and CPU overhead, especially important for high-volume services or when an AI Gateway is handling large data inputs/outputs.
5. Automated Testing: Including Performance and Stress Testing
Reliable systems are built on a foundation of rigorous testing.
- Unit and Integration Tests: Ensure the correctness of individual components and their interactions.
- Performance Testing: Regularly conduct load testing (at expected production loads) and stress testing (beyond expected loads) to identify performance bottlenecks and breaking points. This helps validate capacity planning assumptions and expose "Works Queue Full" scenarios in a controlled environment.
- Chaos Engineering: Introduce controlled failures into your system to test its resilience. This helps uncover unforeseen weaknesses and validate your failure-handling mechanisms.
6. Regular Audits and Reviews: Configurations, Code, Infrastructure
Systems evolve, and so should your review processes.
- Configuration Management: Store all configurations in version control and automate their deployment. Regularly review configuration parameters (queue sizes, thread pool limits, timeouts) to ensure they align with current workload demands and best practices.
- Code Reviews: Conduct thorough code reviews to catch potential performance anti-patterns, resource leaks, or inefficient algorithms before they reach production.
- Infrastructure Audits: Periodically review your infrastructure setup, network topology, and security configurations. Ensure that underlying OS settings (like file descriptor limits, TCP backlog settings) are optimized for high concurrency.
- Incident Post-Mortems: After every significant incident (including "Works Queue Full" errors), conduct a thorough post-mortem analysis. Focus on identifying root causes, learning from the incident, and implementing corrective actions to prevent recurrence.
By embedding these best practices into your development and operational culture, you empower your teams to build, deploy, and maintain systems that are not only high-performing but also inherently resilient to the challenges of dynamic traffic and potential component failures. A robust api gateway or AI Gateway plays an integral role in this, providing the tools and framework to implement many of these best practices effectively, from rate limiting and load balancing to centralized monitoring and intelligent traffic management.
Conclusion
The "Works Queue Full" error, while seemingly a simple message, is a profound indicator of system distress. It signals a critical imbalance between incoming demand and available processing capacity, threatening the stability, performance, and reliability of your applications. From sudden traffic surges to subtle inefficiencies in backend services or misconfigurations in a crucial gateway component, the causes are varied and often interconnected. However, by adopting a systematic and comprehensive approach, these errors are not insurmountable but rather opportunities to build more robust and resilient systems.
Our journey through diagnosing and resolving "Works Queue Full" errors has underscored the paramount importance of observability. Without robust monitoring, detailed logging, and end-to-end tracing, identifying the true bottleneck becomes an exercise in guesswork. Once diagnosed, solutions range from immediate tactical adjustments like increasing queue sizes and implementing rate limiting at the api gateway level, to strategic, long-term architectural enhancements such as code optimization, asynchronous processing, and advanced autoscaling.
The role of a well-chosen api gateway or specialized AI Gateway like ApiPark cannot be overstated. These platforms serve as intelligent traffic managers, providing essential features like rate limiting, circuit breaking, load balancing, and comprehensive analytics. For AI-driven applications, an AI Gateway further specializes, offering high-performance integration and unified management for diverse AI models, ensuring that even complex inference workloads do not overwhelm the system's processing queues.
Ultimately, preventing "Works Queue Full" errors is a continuous commitment to best practices. It involves designing for failure, embracing backpressure mechanisms, relentlessly optimizing performance, and consistently testing your system's limits. By integrating these principles into your development and operational culture, you can move beyond merely reacting to outages. Instead, you can cultivate an infrastructure that is not only capable of withstanding the dynamic pressures of modern digital environments but also thrives under them, delivering consistent performance and reliability to your users.
Frequently Asked Questions (FAQs)
Q1: What exactly does "Works Queue Full" mean and why is it problematic?
A1: "Works Queue Full" means that a component in your system (e.g., a web server, an api gateway, a database connection pool, or a message broker) has exhausted its capacity to accept new tasks or requests. It signifies that the temporary buffer where incoming work awaits processing has reached its maximum limit. This is problematic because new incoming requests will be rejected, leading to service unavailability, increased latency for existing requests, error messages for users (e.g., 503 Service Unavailable), and potentially cascading failures throughout your distributed system as upstream components encounter timeouts and their own queues begin to fill. It's a critical symptom of system overload or a bottleneck.
Q2: How can an api gateway help prevent "Works Queue Full" errors?
A2: An api gateway is crucial in preventing "Works Queue Full" errors by acting as the first line of defense and traffic manager. It can implement: 1. Rate Limiting: Restricting the number of requests per client or per API to prevent individual sources from overwhelming backend services. 2. Circuit Breaking: Automatically stopping traffic to unhealthy or slow backend services, allowing them to recover without additional load and preventing the gateway's own queues from filling up with pending requests. 3. Load Balancing: Distributing incoming requests efficiently across multiple instances of backend services, ensuring no single instance becomes a bottleneck. 4. Throttling/Backpressure: Signaling to clients to reduce their request rate when the system is under stress. 5. Centralized Monitoring: Providing comprehensive metrics and logs that help detect early signs of congestion or performance degradation. Products like ApiPark offer these capabilities with high performance and detailed analytics.
Q3: What's the difference between short-term and long-term solutions for this error?
A3: Short-term solutions are immediate fixes aimed at alleviating the pressure during an active incident. These might include temporarily increasing queue sizes (with caution), applying aggressive rate limits, or manually scaling out instances. They provide quick relief but often don't address the underlying cause. Long-term solutions, on the other hand, focus on addressing the root causes and building sustainable resilience. This involves optimizing application code and database queries, implementing asynchronous processing, refining api gateway configurations, adopting robust caching strategies, designing for autoscaling, and performing regular capacity planning and performance testing. The goal of long-term solutions is to prevent recurrence and ensure system stability.
Q4: Can inefficient AI model inference lead to "Works Queue Full" errors, and how does an AI Gateway address this?
A4: Yes, inefficient AI model inference can absolutely lead to "Works Queue Full" errors. AI models, especially large or complex ones, can be very resource-intensive (CPU, GPU, memory) and have high latency. If many requests for inference arrive simultaneously, and the underlying inference servers or the application invoking them are slow, their processing queues will quickly fill up. An AI Gateway like APIPark specifically addresses this by: 1. Performance Optimization: Designed for high throughput (e.g., 20,000+ TPS), it can handle a large volume of concurrent AI inference requests. 2. Unified Management: It provides a standardized way to invoke diverse AI models, offloading complex model-specific logic from application queues to the efficient gateway. 3. Load Balancing & Scaling: It can distribute AI inference requests across multiple model servers and supports cluster deployment, ensuring horizontal scalability. 4. Monitoring AI Workloads: With detailed logging and data analysis, it can track AI model performance, identify slow models, and help in proactive optimization before queues get full.
Q5: What best practices should I follow to prevent "Works Queue Full" errors in the first place?
A5: Proactive prevention is key. Here are essential best practices: 1. Comprehensive Observability: Implement robust monitoring, logging, and distributed tracing across all services and infrastructure to detect early warning signs. 2. Design for Failure: Architect your system with redundancy, isolation (bulkheads), graceful degradation, and intelligent retry mechanisms. 3. Performance Optimization: Continuously optimize application code, database queries, and caching strategies. 4. Capacity Planning & Autoscaling: Regularly assess resource needs, forecast growth, and implement dynamic autoscaling based on demand. 5. Traffic Management: Utilize api gateway features like rate limiting, throttling, and circuit breakers effectively. 6. Automated Testing: Conduct regular load, stress, and performance testing to identify bottlenecks before production. 7. Regular Audits: Periodically review configurations, code, and infrastructure for potential weaknesses.
🚀You can securely and efficiently call the OpenAI API on APIPark in just two steps:
Step 1: Deploy the APIPark AI gateway in 5 minutes.
APIPark is developed based on Golang, offering strong product performance and low development and maintenance costs. You can deploy APIPark with a single command line.
curl -sSO https://download.apipark.com/install/quick-start.sh; bash quick-start.sh

In my experience, you can see the successful deployment interface within 5 to 10 minutes. Then, you can log in to APIPark using your account.

Step 2: Call the OpenAI API.