What Information Can eBPF Tell Us About an Incoming Packet?


In the labyrinthine world of modern networking, understanding the precise journey and characteristics of an incoming packet has evolved from a mere technical challenge into a critical necessity for performance optimization, robust security, and efficient troubleshooting. Traditional network monitoring tools, often confined to user-space or limited kernel interfaces, provide valuable but often superficial insights, leaving many questions unanswered about the true nature of data flow at the very heart of the operating system. Enter eBPF (extended Berkeley Packet Filter), a revolutionary technology that has fundamentally transformed our ability to peer deep into the kernel, offering unprecedented visibility into every facet of an incoming packet’s life cycle.
eBPF empowers developers to run sandboxed programs within the Linux kernel, triggered by various events, including network packet arrival. This capability allows for dynamic, on-the-fly instrumentation of the kernel without the need for recompilation or rebooting, providing a safe, efficient, and profoundly granular mechanism for data collection and analysis. From the moment a raw byte stream hits the network interface card (NIC) to its final delivery to an application, eBPF can intercept, inspect, and extract a wealth of information that was previously either inaccessible or obtainable only through arduous, intrusive methods. This article delves into the profound details eBPF can reveal about an incoming packet, exploring the types of data it can expose, the various vantage points it offers, and the transformative impact this visibility has on network observability, security, and performance, especially in complex environments involving gateways and intricate api interactions, even extending to specialized communication like an mcp protocol.
The Genesis of a Packet: Traditional Views vs. eBPF's Deep Dive
To appreciate the power of eBPF, it's essential to first understand the traditional journey of an incoming packet. When data arrives at a server, it traverses multiple layers of the network stack. Initially, the NIC receives electrical or optical signals and converts them into digital frames. These frames are then passed up the kernel's network stack:
- Data Link Layer (Layer 2): The kernel processes the Ethernet header, examining MAC addresses and potentially VLAN tags. If the destination MAC matches the host or a broadcast/multicast address, the packet proceeds.
- Network Layer (Layer 3): The IP header is parsed, verifying checksums, examining source and destination IP addresses, and determining if the packet is for this host, needs routing, or is fragmented.
- Transport Layer (Layer 4): For TCP or UDP, ports are extracted, sequence numbers are checked, and the packet is associated with an existing connection or dispatched to a new one. Congestion control mechanisms also come into play here for TCP.
- Application Layer (Layer 5-7): Finally, the payload data is delivered to a waiting application process via a socket.
Traditional tools often operate at user-space, relying on kernel interfaces like /proc or sysfs, or using libraries like libpcap which essentially tap into points after significant kernel processing has already occurred. While useful, these methods can introduce latency, miss transient states, or simply not have access to the intricate, real-time internal kernel logic that dictates a packet's fate.
eBPF, conversely, shatters these limitations. By allowing custom programs to execute directly within the kernel at a multitude of predefined "hooks" – ranging from the very instant a packet enters the NIC driver (XDP) to its interaction with a socket or even specific kernel functions (kprobes) – eBPF provides a granular, surgical approach to data extraction. This kernel-level access means eBPF programs can observe a packet as it traverses these layers, gaining insights into its state and associated kernel context at each crucial step, effectively providing a magnifying glass into the kernel's internal decision-making process for every single incoming byte.
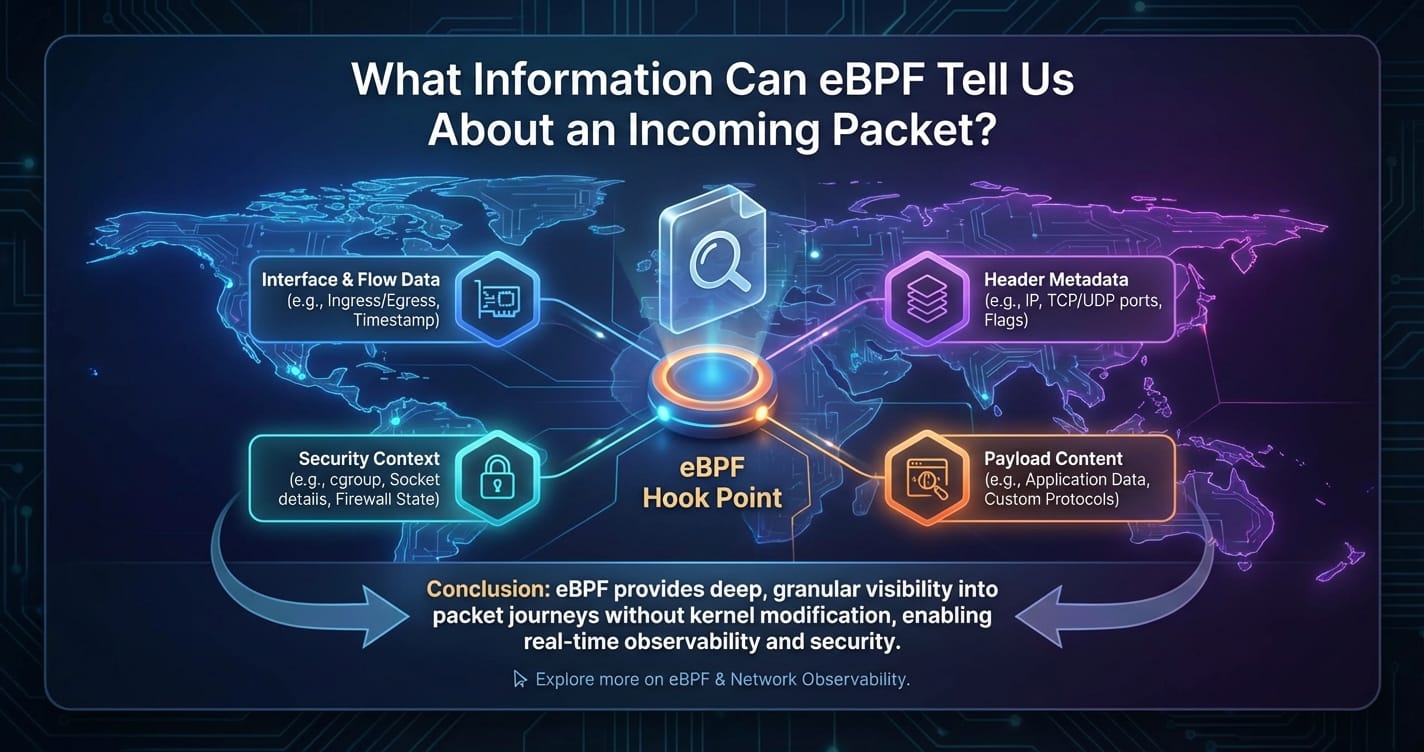
eBPF's Observational Vantage Points: A Layer-by-Layer Deconstruction
eBPF's strength lies in its ability to attach programs at various strategic points within the kernel. Each vantage point offers a unique perspective and access to different levels of packet information.
1. The Earliest Interception: XDP (eXpress Data Path)
Vantage Point: XDP programs are attached directly to the network driver, executing before the packet enters the kernel's main network stack. This is the earliest possible point of interception for an incoming packet.
Information Available: At this layer, eBPF programs have access to the raw Ethernet frame data, precisely as it arrives from the NIC. This includes:
- Raw Frame Data: The entire byte stream of the incoming packet, including the Ethernet header, IP header, transport header, and application payload.
- MAC Addresses: Both source and destination MAC addresses from the Ethernet header. These are crucial for identifying the physical sender and the intended immediate recipient on the local network segment.
- EtherType/VLAN Tags: The EtherType field identifies the protocol encapsulated in the frame (e.g., IPv4, IPv6, ARP). VLAN tags, if present, reveal the virtual LAN the packet belongs to, which is vital in multi-tenant or segmented network environments.
- Initial Error States: Depending on the NIC and driver, XDP programs might be able to infer certain low-level hardware or driver-level error conditions that occurred during reception.
Significance: The ability to inspect packets at the XDP layer is profoundly powerful for several reasons. It allows for ultra-high-performance packet processing, enabling actions like dropping malicious packets (DDoS mitigation), forwarding packets (load balancing), or redirecting them to specific queues before they consume significant kernel resources. For example, a web gateway experiencing a SYN flood can leverage XDP to drop or rate-limit suspicious SYN packets based on source IP or other header fields, protecting the upstream applications. The speed and efficiency here are unmatched, as processing happens directly in the driver's receive path, bypassing much of the kernel's traditional network stack overhead.
2. Deeper within the Stack: TC and Socket Hooks
As a packet progresses beyond the XDP layer (or if no XDP program is attached), it enters the full Linux network stack. Here, eBPF can attach programs at various traffic control (TC) points or directly to socket operations, providing a more structured view of the packet's contents as it is parsed layer by layer.
Layer 2 (Data Link) Insights
While some Layer 2 info is available at XDP, TC hooks can also re-examine it within the context of the kernel's internal processing.
- MAC Addresses (Source/Destination): Again, these provide the immediate physical origin and destination on the local network segment. Observing these at TC hooks can confirm proper Layer 2 forwarding or identify spoofing attempts if they don't align with expected values.
- VLAN Tags: Essential for understanding network segmentation and ensuring packets are correctly isolated or routed within their virtual networks.
- MPLS Labels (if present): In MPLS networks, these labels dictate the forwarding path. eBPF can read these to trace a packet's journey within an MPLS domain.
Layer 3 (Network) Insights
Once the Ethernet header is processed, the IP header becomes the focus. eBPF programs can extract extensive details from this layer:
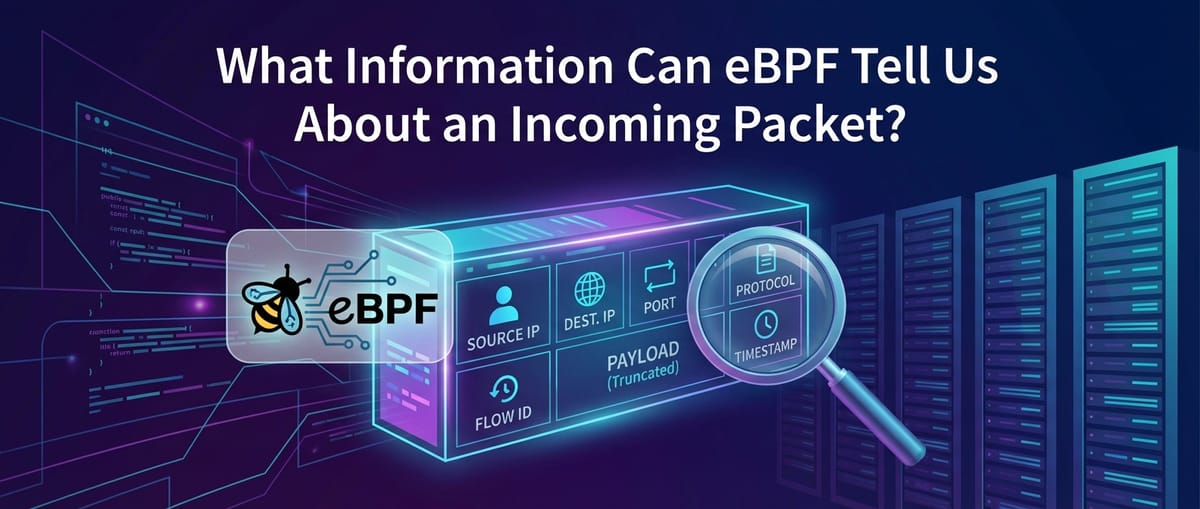
- IP Addresses (Source/Destination): The cornerstone of network communication, these identify the ultimate sender and recipient across networks. Monitoring these is fundamental for security, access control, and traffic analysis. For an api call arriving at a gateway, the source IP identifies the client, and the destination IP points to the specific server or load balancer.
- IP Header Fields:
- TTL (Time To Live): Indicates the maximum number of hops a packet can take. A decreasing TTL can be monitored to detect routing loops or diagnose network path issues.
- Protocol Type: Identifies the encapsulated Layer 4 protocol (e.g., TCP, UDP, ICMP). This allows eBPF programs to branch their logic based on the transport layer protocol.
- IP Flags (e.g., Don't Fragment): Essential for understanding fragmentation behavior and diagnosing network paths that might be dropping fragmented packets.
- Fragmentation Information: If a packet is fragmented, eBPF can extract the fragment offset and identification fields, which are crucial for reassembling the original IP datagram.
- TOS/DSCP (Type of Service/Differentiated Services Code Point): These fields are used for Quality of Service (QoS), indicating preferred forwarding treatment. eBPF can observe if QoS markings are being correctly applied or honored.
Layer 4 (Transport) Insights
For TCP and UDP packets, the transport layer provides vital information about connections and application endpoints.
- TCP/UDP Ports (Source/Destination): These identify the specific application processes communicating. For an api request, the destination port is typically 80 (HTTP) or 443 (HTTPS), while the source port is an ephemeral client port. Monitoring port usage is critical for security and service discovery.
- TCP Specifics:
- Sequence/Acknowledgment Numbers: Fundamental for reliable data transfer, indicating byte ordering and receipt. Anomalies can signify dropped packets or connection issues.
- Window Sizes: Advertised receive window sizes influence flow control. Small or zero window sizes can indicate receiver congestion.
- TCP Flags (SYN, ACK, FIN, RST, PSH, URG): These flags reveal the state of a TCP connection (e.g., SYN for connection establishment, FIN for graceful termination, RST for abrupt reset). Monitoring flag sequences is vital for detecting connection hijacking, port scanning, or abnormal connection behavior. A gateway often sees a high volume of SYN packets as new connections are established.
- Congestion Control States: eBPF can potentially access internal kernel structures that reflect the state of TCP congestion control algorithms (e.g., Reno, CUBIC), offering insights into network performance and bottlenecks.
- Retransmissions: Identifying retransmitted packets is a direct indicator of packet loss and network instability, which directly impacts application performance, especially for latency-sensitive api calls.
Layer 5+ (Application) Insights: Peering into the Payload
While eBPF programs are traditionally limited in parsing large payloads due to complexity and performance considerations, they can still extract significant application-level information, particularly from the initial bytes of a payload or by leveraging kernel-level context.
- Initial Data Payload Inspection: Even a few bytes of the payload can often reveal the application protocol. For instance:
- HTTP: The characteristic "GET /", "POST /" strings, or "HTTP/" can identify an HTTP request.
- TLS Handshake: The initial "Client Hello" message structure reveals the start of a TLS negotiation.
- DNS: The fixed-format header of a DNS query or response.
- Protocol Identification: eBPF can effectively classify traffic by application protocol based on port numbers and initial payload patterns.
- HTTP/HTTPS Insights (with limitations):
- URL Paths and Methods: For unencrypted HTTP, eBPF can parse the URL path (e.g.,
/api/v1/users) and HTTP method (GET, POST, PUT, DELETE). This is invaluable for monitoring api endpoint usage and detecting unauthorized access. A gateway would process this information for routing and policy enforcement. - HTTP Headers: Certain critical headers like
Host,User-Agent,Content-Type, or custom headers relevant to an api can be extracted. - Request/Response Sizes: By tracking the
Content-Lengthheader or the total bytes transmitted/received, eBPF can measure API request and response sizes, useful for performance profiling and capacity planning. - Status Codes (for outgoing responses): While this article focuses on incoming packets, eBPF can also observe outgoing packets, including HTTP responses, revealing status codes (200 OK, 404 Not Found, 500 Internal Server Error) which are critical for api health monitoring.
- URL Paths and Methods: For unencrypted HTTP, eBPF can parse the URL path (e.g.,
- DNS: eBPF can parse DNS queries to extract the queried domain names and query types (A, AAAA, MX, etc.). This is powerful for security (detecting malicious domain lookups) and performance (identifying slow DNS resolutions).
- Custom Protocols (e.g., MCP Protocol): One of eBPF's most compelling features is its programmability. If an organization uses a custom internal protocol, such as an mcp protocol (Master Control Protocol or Message Control Program protocol) for inter-service communication in a distributed system, eBPF can be tailored to understand it. By knowing the structure of the mcp protocol's header or key fields within its payload, an eBPF program can be written to:
- Identify specific mcp protocol message types (e.g., "command," "status update," "heartbeat").
- Extract message IDs or transaction identifiers, allowing for end-to-end tracing of mcp protocol interactions.
- Monitor the frequency and latency of mcp protocol messages between services, crucial for understanding the health and performance of the distributed system.
- Detect malformed mcp protocol messages or unauthorized commands, providing a unique security layer for internal communication. This flexibility is what sets eBPF apart from rigid, predefined protocol analyzers.
3. Contextual Information: Beyond the Packet Itself
eBPF's access extends beyond the packet data. It can also tap into the rich context within the kernel at the time of the packet's arrival and processing.
- Process Information: Critically, eBPF can determine which process on the host is receiving or sending the packet. This includes:
- PID (Process ID): The unique identifier of the process.
- Process Name: The executable name (e.g.,
nginx,java,python). - UID/GID (User ID/Group ID): The user and group under which the process is running, vital for security auditing and understanding permissions.
- Container ID/Namespace: For containerized environments (Docker, Kubernetes), eBPF can identify the network namespace or even the container ID associated with the packet, providing crucial context for microservices visibility.
- Socket Information: eBPF can inspect the state and characteristics of the socket involved in the packet transfer, such as:
- Socket State: (e.g.,
ESTABLISHED,LISTEN,CLOSE_WAIT). - Inode Number: A unique identifier for the socket in the file system.
- Associated File Descriptors: Which file descriptor in the process is handling the socket.
- Socket State: (e.g.,
- Network Namespace: For systems leveraging network namespaces (common in containerization), eBPF can identify which specific network namespace the packet belongs to, offering unparalleled isolation and debugging capabilities for complex, multi-tenant environments.
- Timestamps: eBPF allows for high-precision timestamps (nanosecond resolution) of when a packet hits a specific hook point. This is fundamental for accurate latency measurement, jitter analysis, and precise event correlation across different layers.
- CPU Information: The CPU core on which the eBPF program executed to process the packet. This can be useful for diagnosing CPU affinity issues or load distribution.
- Kernel Internal State: Depending on the specific eBPF hook and available kernel helpers, eBPF programs can even peek into certain kernel data structures related to networking, such as routing tables, conntrack entries, or even scheduling information impacting packet processing.
Practical Applications and Transformative Use Cases
The ability to extract such a diverse and detailed array of information about an incoming packet fundamentally transforms how we approach network management, security, and performance optimization.
1. Advanced Network Observability and Monitoring
eBPF elevates network observability from high-level statistics to granular, per-packet insights.
- Real-time Traffic Analysis: Instead of relying on periodic
netstatdumps or aggregated flow data, eBPF provides real-time visibility into every packet's characteristics. This enables live monitoring of traffic patterns, bandwidth utilization, and protocol distribution with unprecedented accuracy. For an api gateway, this means understanding exactly which APIs are receiving traffic, from where, and at what rate, in real-time. - Latency and Jitter Measurement: By timestamping packets at various kernel hooks, eBPF can precisely measure the latency introduced by different parts of the network stack, the NIC, or even the application processing. This is critical for identifying performance bottlenecks in high-frequency trading systems or low-latency api services. Jitter can also be quantified by analyzing the variability in packet arrival times.
- "Noisy Neighbor" Identification: In multi-tenant cloud environments, a single misbehaving application can consume excessive network resources, impacting others. eBPF can precisely attribute network resource consumption (bandwidth, connections, retransmissions) to individual processes, containers, or network namespaces, making "noisy neighbor" detection straightforward.
- Detailed API Call Monitoring: For microservices architectures, every interaction is an api call. eBPF can trace these calls from the network ingress, through the gateway, and to the target service. It can identify the specific HTTP method, path, and even relevant headers for each incoming api request, providing invaluable data for service mesh integration, performance troubleshooting, and usage analytics.
- Custom Protocol Insights: The flexibility to parse an mcp protocol or any other proprietary protocol allows organizations to gain visibility into the internal communication patterns of their bespoke distributed systems. This insight can be used for performance tuning, dependency mapping, and ensuring the health of the internal control plane.
2. Robust Security and Threat Detection
eBPF's kernel-level vantage point makes it an incredibly powerful tool for enhancing network security.
- Advanced Firewalling and Access Control: XDP-based eBPF programs can implement highly efficient stateless or stateful firewalls at the earliest possible point. This allows for blocking malicious traffic (e.g., known bad IPs, specific port scans, or patterns indicative of DDoS attacks) with minimal overhead, even before the packets consume significant kernel resources.
- Detecting Suspicious Packet Patterns: eBPF can monitor for unusual flag combinations (e.g., TCP SYN-FIN packets), unexpected IP fragmentation, or packets with malformed headers, which are often indicative of scanning attempts, exploitation attempts, or network reconnaissance.
- Unauthorized Access Attempts at the Gateway: A gateway is the first line of defense for applications. eBPF can monitor all incoming connection attempts and api requests, identifying unusual source IPs, high rates of failed authentication attempts, or requests to unauthorized api endpoints. This provides real-time alerts for potential breaches.
- Micro-segmentation Enforcement: In containerized environments, eBPF can enforce network policies at a very granular level, ensuring that only authorized services can communicate with each other, effectively implementing micro-segmentation that is independent of traditional IPtables.
- Monitoring Internal Protocol Anomalies: For systems relying on an mcp protocol, eBPF can monitor for deviations from expected mcp protocol message sequences, unexpected command types, or communication from unauthorized sources, providing early warnings for internal security threats or misconfigurations within critical infrastructure.
- Supply Chain Security: By monitoring the network traffic of newly deployed software or third-party libraries, eBPF can detect unexpected outbound connections or unusual communication patterns, helping to identify potential supply chain compromises.
3. Performance Optimization and Troubleshooting
Diagnosing network-related performance issues often involves sifting through logs and using limited tools. eBPF offers surgical precision.
- Pinpointing Network Bottlenecks: By measuring latency at different kernel hooks, eBPF can identify exactly where delays are occurring – is it the NIC, the kernel stack, or the application? This helps to differentiate between network, CPU, or application-level issues.
- Analyzing TCP Performance: Detailed metrics on TCP retransmissions, out-of-order packets, window size issues, and congestion control states provide a deep understanding of TCP health. This can reveal problems with network paths, intermediate devices, or receiver-side congestion that impact api response times.
- Optimizing Load Balancing: XDP-based load balancers can make intelligent forwarding decisions based on real-time packet data, achieving higher throughput and lower latency than traditional software load balancers.
- Application-Specific Performance Metrics: By parsing application-layer data (e.g., HTTP paths), eBPF can collect performance metrics tailored to specific api endpoints without requiring changes to the application code itself. This allows for fine-grained performance monitoring of individual microservices or API versions.
- Root Cause Analysis: When an api call fails or experiences high latency, eBPF can provide a detailed timeline of that specific packet's journey through the kernel, identifying exactly where it was dropped, misrouted, or delayed, dramatically accelerating root cause analysis.
The Role of API Gateways and Complementary Platforms
Gateways are indispensable components in modern distributed architectures, serving as the single entry point for all api traffic. They handle routing, load balancing, authentication, rate limiting, and often provide high-level monitoring for API usage. The sheer volume and complexity of api interactions that pass through a gateway necessitate robust visibility tools.
While gateways themselves provide crucial application-level insights, eBPF offers a complementary, kernel-level view that can augment and validate the data reported by the gateway. For instance, an eBPF program can independently verify the number of connections reaching the gateway, the packet loss rates experienced by api requests, or even detect network anomalies before the gateway application itself becomes aware of them. This holistic visibility is particularly valuable for complex setups where microservices communicate, potentially using specialized protocols like an mcp protocol, behind the main gateway.
For organizations managing a multitude of APIs, especially those leveraging AI models, platforms like ApiPark offer comprehensive API lifecycle management, performance monitoring, and security features. APIPark, as an open-source AI gateway and API management platform, provides powerful capabilities for quick integration of 100+ AI models, unified API formats, prompt encapsulation into REST API, and end-to-end API lifecycle management with features like performance rivaling Nginx and detailed API call logging. While APIPark provides robust high-level metrics and controls, eBPF can complement such a platform by offering granular, kernel-level insights into the underlying network traffic that powers these API interactions. This allows for unprecedented detail in performance troubleshooting and security auditing, particularly for complex scenarios like managing unified API formats or custom prompt encapsulations for AI models where deep network-level visibility can uncover subtle performance degradations or security vulnerabilities that might not be immediately apparent at the application layer. Together, API management platforms and eBPF create a powerful synergy for managing and observing the entire API ecosystem from the network edge to the kernel.
APIPark is a high-performance AI gateway that allows you to securely access the most comprehensive LLM APIs globally on the APIPark platform, including OpenAI, Anthropic, Mistral, Llama2, Google Gemini, and more.Try APIPark now! 👇👇👇
Challenges and Considerations for eBPF Packet Analysis
Despite its immense power, working with eBPF for packet analysis presents its own set of challenges:
- Complexity of Development: Writing eBPF programs requires a deep understanding of kernel internals, networking protocols, and the C language (or Rust, Go with specific libraries). The eBPF verifier also imposes strict safety rules, which can make program development challenging.
- Performance Overhead: While generally minimal and highly efficient, poorly written or overly complex eBPF programs can introduce performance overhead. Careful design, testing, and optimization are crucial, especially at high packet rates.
- Security Implications: Running code in the kernel, even sandboxed, carries inherent security risks. The eBPF verifier mitigates many of these, but careful auditing of eBPF programs is always necessary.
- Visibility into Encrypted Traffic (TLS): eBPF, by itself, cannot decrypt TLS-encrypted traffic. To gain application-layer insights into HTTPS or other TLS-encrypted api calls, eBPF needs to be combined with techniques like userspace TLS session key logging or dedicated proxies that perform decryption. However, it can still provide valuable metadata even for encrypted packets (source/destination IPs/ports, connection states, packet sizes).
- User-Space Integration: eBPF programs run in the kernel, but their output needs to be collected, processed, aggregated, and presented in user-space for meaningful analysis. This requires sophisticated user-space agents and visualization tools.
- Kernel Version Dependencies: While eBPF aims for stability, new features and helper functions are continuously added, and some programs might have dependencies on specific kernel versions.
A Summary of eBPF Packet Information Capabilities
The following table summarizes the types of information eBPF can extract from an incoming packet, categorized by network layer and the typical vantage point.
| Layer | Type of Information | Specific Details | Typical eBPF Hook/Vantage Point(s) | Relevance for Observability/Security/Performance |
|---|---|---|---|---|
| Layer 2 (Data Link) | Frame Data | Raw Ethernet frame, MAC Addresses (Source/Destination), EtherType, VLAN Tags, MPLS Labels (if present), initial hardware error flags. | XDP, TC | High-performance pre-filtering (DDoS), physical device identification, network segmentation verification, troubleshooting local network issues. Crucial for gateway initial packet handling. |
| Layer 3 (Network) | IP Header Details | Source/Destination IP Addresses, Protocol (TCP/UDP/ICMP), TTL, TOS/DSCP, IP Flags (DF, MF), Fragmentation Info (ID, offset), Header Length, Checksum. | XDP, TC | Routing verification, source identification, QoS monitoring, detecting network attacks (fragmentation attacks), identifying routing loops. Fundamental for network-wide traffic analysis and api client identification. |
| Layer 4 (Transport) | TCP/UDP Header Details | Source/Destination Ports, TCP Sequence/Acknowledgment Numbers, Window Size, TCP Flags (SYN, ACK, FIN, RST, PSH, URG), Checksum, TCP Options, UDP Length. | TC, Socket Hooks | Connection state tracking, port scanning detection, flow control monitoring, retransmission analysis, diagnosing network congestion, service identification. Essential for api connection health and performance. |
| Layer 5-7 (Application) | Application Protocol Identification & Payload Snippets | HTTP Method/Path/Host, DNS Query/Response (domain, type), TLS Handshake start, initial bytes for protocol inference, specific fields of custom protocols (e.g., mcp protocol message type, ID). | TC, Socket Hooks, Kprobes/Uprobes | API endpoint usage, service dependency mapping, custom protocol monitoring (e.g., mcp protocol interactions), security anomaly detection at the application layer, high-level traffic classification. Requires careful parsing within eBPF program. |
| Contextual Information | Kernel & System Context | Process ID (PID), Process Name, User ID (UID), Group ID (GID), Network Namespace ID, Container ID, Socket Inode, CPU Core ID, High-precision Timestamps, Kernel Internal State (e.g., conntrack entries, routing decisions). | Various Hooks (XDP, TC, Kprobes) | Attributing network traffic to specific applications/containers, understanding execution context, accurate latency measurement, troubleshooting "noisy neighbors," deep kernel behavior analysis. Provides the "who, when, where" of packet processing. |
The Future of eBPF in Network Observability
The journey of eBPF in network observability is still in its early stages, yet its trajectory is steep and promising. We can anticipate:
- Further Kernel Integration: More eBPF hooks and helper functions will be exposed, providing even finer-grained control and access to kernel data structures.
- Enhanced Tooling and Frameworks: The ecosystem around eBPF is rapidly maturing, with new user-space tools, libraries, and higher-level languages emerging to simplify eBPF program development and data visualization. This will make eBPF more accessible to a broader range of developers and operations teams.
- Cloud-Native and Kubernetes Integration: eBPF is already a cornerstone of many Kubernetes networking and security solutions, and this integration will deepen, offering native, highly efficient ways to observe and secure containerized workloads.
- AI/ML Driven Anomaly Detection: The rich, real-time data stream provided by eBPF is an ideal input for AI and machine learning models to detect subtle network anomalies, predict performance issues, and identify novel security threats with greater accuracy. This could revolutionize proactive network management.
- Standardization of Protocol Parsers: As eBPF matures, we might see standardized eBPF-based libraries for parsing common application protocols, reducing the development burden and improving interoperability. This could extend to more generalized ways of defining and parsing custom protocols like an mcp protocol.
Conclusion
The question "What information can eBPF tell us about an incoming packet?" reveals a universe of data previously obscured within the kernel's depths. From the raw bytes landing on the NIC to the nuanced interactions with an application, eBPF provides an unparalleled lens, allowing us to scrutinize every aspect of a packet's journey. It demystifies network traffic, transforming it from an opaque flow into a richly detailed narrative.
This revolutionary technology empowers network engineers, security professionals, and developers to move beyond superficial statistics, enabling them to: * Observe: Gain deep, real-time visibility into every network flow, including intricate api interactions and custom mcp protocol communications, across physical and virtual boundaries. * Secure: Implement robust, high-performance security policies at the earliest possible point, detecting and mitigating threats from the kernel's core. * Optimize: Pinpoint performance bottlenecks with surgical precision, leading to more efficient networks and faster, more reliable applications and gateway services.
eBPF represents a paradigm shift, providing the foundational technology for the next generation of network observability, security, and performance tools. Its ability to dynamically program the kernel without compromising stability or performance makes it an indispensable asset in navigating the ever-increasing complexity of modern distributed systems and their intricate web of incoming packets. As eBPF continues to evolve, its impact on how we understand and interact with our networks will only grow, paving the way for more resilient, secure, and performant digital infrastructures.
Frequently Asked Questions (FAQs)
1. How does eBPF gain access to kernel-level packet information without modifying the kernel? eBPF achieves this through a mechanism where user-defined, sandboxed programs are loaded into the Linux kernel and executed at specific "hook points." These hooks are predefined locations within the kernel's execution path, such as network device drivers (XDP), traffic control (TC) ingress/egress points, socket operations, or general kernel function calls (kprobes). The eBPF verifier ensures that these programs are safe to run (e.g., no infinite loops, memory access violations) and then a JIT (Just-In-Time) compiler translates the eBPF bytecode into native machine code for efficient execution directly within the kernel. This allows for dynamic instrumentation and data extraction without the need for recompiling or rebooting the kernel source.
2. Can eBPF decrypt and inspect the full payload of HTTPS (TLS encrypted) incoming packets? No, eBPF by itself cannot decrypt TLS-encrypted traffic. TLS encryption occurs at the application layer, and the kernel network stack processes the encrypted data as opaque bytes. For eBPF to inspect the decrypted content of an HTTPS packet, it would need access to the session keys used for encryption. This is typically achieved through techniques like: a. Userspace TLS key logging: Where the application (e.g., browser, server) is configured to log TLS session keys, which can then be used by a separate eBPF-aware decryption tool. b. Integration with a TLS proxy: An intermediary proxy (like an API gateway) that performs TLS termination and can expose the decrypted traffic or pass it through a mechanism eBPF can tap into. However, eBPF can still extract valuable metadata from encrypted packets, such as source/destination IP addresses and ports, TCP flags, connection states, and packet sizes, even without decryption.
3. What is the performance impact of using eBPF for deep packet inspection? The performance impact of eBPF is generally minimal and highly efficient, especially when compared to traditional kernel modules or user-space packet capturing methods. This is due to several factors: a. Kernel-mode execution: eBPF programs run directly in the kernel, avoiding costly context switches between user and kernel space. b. JIT compilation: eBPF bytecode is compiled into native machine instructions, ensuring near-native execution speed. c. Strict verifier: The verifier optimizes code and prevents unsafe operations that could degrade performance or crash the kernel. d. XDP for early drop/forward: At the XDP layer, packets can be processed and potentially dropped or redirected even before entering the full network stack, significantly reducing load. However, the actual impact depends on the complexity of the eBPF program, the number of hooks it attaches to, and the packet processing rate. Complex parsing logic or extensive computations within an eBPF program can introduce measurable overhead, requiring careful design and optimization.
4. How does eBPF help in monitoring API calls, especially when an API Gateway like APIPark is involved? eBPF enhances API call monitoring by providing granular, kernel-level visibility beneath the API gateway's application layer. While an API gateway like ApiPark offers robust high-level metrics, routing, and security for APIs, eBPF can fill critical gaps by: a. Network-level verification: Confirming that incoming requests are actually reaching the gateway without being dropped or delayed at the network stack level. b. Pre-gateway security: Implementing extremely fast DDoS mitigation or traffic filtering at the XDP layer, protecting the gateway itself. c. Underlying performance analysis: Identifying network bottlenecks (e.g., TCP retransmissions, high latency within the kernel) that affect API response times, even if the gateway's logs report successful processing. d. Process-level attribution: Linking API traffic to the specific container or process running the gateway or backend services, crucial for "noisy neighbor" detection in multi-tenant environments. e. Custom protocol visibility: If internal microservices behind the gateway use specialized protocols, eBPF can monitor these interactions. In essence, eBPF provides the foundational network context that complements and validates the application-level data from the API gateway.
5. What kind of custom protocols can eBPF analyze, and how does it do it? eBPF can analyze virtually any custom or proprietary protocol, provided its structure is known to the eBPF program developer. This includes protocols like the hypothetical mcp protocol mentioned earlier, which might be used for inter-service communication or industrial control. eBPF achieves this by: a. Direct payload access: eBPF programs can access the raw packet payload (within safe limits imposed by the verifier). b. Programmable parsing logic: Developers write C-like code within the eBPF program to parse the custom protocol's header fields, message types, identifiers, or other relevant data points. This logic uses standard C structures and pointer arithmetic to interpret the byte stream according to the protocol's specification. c. Contextual mapping: The extracted data can then be mapped to specific kernel events or contexts, allowing the eBPF program to generate custom metrics, logs, or triggers based on the custom protocol's behavior. This flexibility is a significant advantage over traditional network analyzers that often only support a predefined set of standard protocols, allowing organizations to gain deep visibility into their unique communication patterns.
🚀You can securely and efficiently call the OpenAI API on APIPark in just two steps:
Step 1: Deploy the APIPark AI gateway in 5 minutes.
APIPark is developed based on Golang, offering strong product performance and low development and maintenance costs. You can deploy APIPark with a single command line.
curl -sSO https://download.apipark.com/install/quick-start.sh; bash quick-start.sh

In my experience, you can see the successful deployment interface within 5 to 10 minutes. Then, you can log in to APIPark using your account.

Step 2: Call the OpenAI API.