Creating an effective and efficient dashboard in Datadog is crucial for organizations that strive to maintain superior performance in their applications and infrastructure. With the right optimizations, your Datadog dashboard can act not just as a monitoring tool but as a strategic asset in your overarching API Governance and enterprise security framework.
Importance of Dashboards in Performance Monitoring
Before diving into optimization strategies, it is essential to understand the significance of performance monitoring dashboards. Organizations rely on these dashboards to visualize metrics, track performance, identify issues, and analyze trends over time. The more streamlined and informative your Datadog dashboard is, the better positioned your organization will be to respond swiftly to performance bottlenecks or security concerns.
Having a well-optimized dashboard can help organizations monitor their AWS API Gateway, optimize response times, and utilize AI and machine learning to gain insights from data. This is even more crucial when your API uses various authentication mechanisms, such as Basic Auth, AKSK, and JWT, to ensure secure access.
Components of an Optimized Datadog Dashboard
An optimized Datadog dashboard combines various elements that work together for seamless monitoring and management. Here are some key components to consider:
- Widgets: Choose the right widgets to visualize your data effectively, ensuring that all vital metrics are visible at a glance.
- Filtering Capability: Incorporate filters that allow you to drill down into specific performance metrics, such as those related to API calls or specific microservices.
- Layout and Organization: Arrange the widgets in an organized manner so that the most critical data points are easy to find.
- Alerts and Notifications: Setup trigger alerts that inform the team of any anomalies or performance issues.
- Integration with AI Services: Leverage AI-driven insights for predictive analytics to foresee potential issues before they materialize.
Tables and Layout Examples
To give a clearer understanding of an optimized layout, consider the following example table that outlines potential metrics to monitor on your Datadog dashboard:
| Metric | Description | Visualization Type |
|---|---|---|
| API Response Time | Average time taken by your API to respond | Line Chart |
| Request Count | Total number of requests processed | Bar Chart |
| Error Rate | Percentage of failed API calls | Pie Chart |
| Latency | Time taken for data to travel | Heat Map |
| CPU Usage | Percentage of CPU in use | Gauge |
| Memory Usage | Amount of memory currently utilized | Time Series |
Optimizing Widgets for Performance Monitoring
Right Widgets for the Job
Choosing the correct widgets is essential for getting actionable insights from your Datadog dashboard. The following widgets are highly recommended:
- Time Series: Display metrics over time to identify trends and seasonal changes in performance.
- Query Value: Show real-time data points, like the current number of requests to an API.
- Heat Map: Great for illustrating latency across different microservices, especially useful for identifying potential performance roadblocks.
Customizing Widget Settings
Fine-tuning the settings of each widget can significantly enhance the clarity of the information displayed. Here are some critical adjustments you might consider:
- Time Frame Selection: Allow users to select different time frames for data representation (last hour, last 24 hours, etc.).
- Aggregation Methods: Use methods such as average, maximum, or sum to consolidate data points meaningfully.
Efficiency Over Clutter
While it may be tempting to populate your dashboard with numerous metrics, it’s better to focus on the most crucial ones that offer immediate insights. Too many widgets can lead to dashboard clutter, making it harder to focus on what actually matters.
API Governance and Security in Monitoring
As organizations leverage AI and other cutting-edge technologies, the importance of API governance and security measures grows exponentially. In this context, it’s essential to ensure compliance and maintain a secure environment. When utilizing AWS API Gateway, consider using the following security mechanisms in your monitoring strategy:
- Basic Auth: Implement Basic Authentication for simple username/password access control.
- AKSK (Access Key Secret Key): Use this for authenticating service-to-service calls to your APIs.
- JWT (JSON Web Tokens): JWT can be employed for token-based authentication and granting access to restricted areas of your APIs.
Integrating Security Metrics into Datadog
Integrating these various authentication methods into your Datadog dashboard can help you maintain oversight of security incidents. Create dedicated widgets that track:
- Authentication Failure Rates: Monitor failed login attempts over time.
- Token Expiry Reports: Create alerts for tokens nearing expiry.
Utilizing AI for Predictive Maintenance
As mentioned earlier, leveraging AI and machine learning capabilities can offer insights that static monitoring cannot. For instance, AI tools can analyze past API usage patterns—particularly focusing on those using Basic Auth, AKSK, and JWT—to predict when downtime may occur or when performance may falter.
Example of API Call through AI Service
Here’s a code example demonstrating how to call an AI service that can help with predictive analysis of your API performance metrics:
curl --location 'http://your_predicitve_ai_service:port/analyze' \
--header 'Content-Type: application/json' \
--header 'Authorization: Bearer your_api_token' \
--data '{
    "metrics": {
        "request_count": 100,
        "error_rate": 0.05,
        "response_time": 250
    }
}'
Make sure to adjust your_predictive_ai_service, port, and your_api_token to fit your context. This code represents a basic call that would send your current API metrics to a predictive analysis service.
Final Thoughts on Optimization
Optimizing your Datadog dashboard for better performance monitoring is an ongoing process. Regularly revisit your metrics, adjust your monitoring strategy, and test new widgets or features as they become available. Keeping security and compliance at the forefront of your monitoring without sacrificing effectiveness will provide the agility your organization needs.
To summarize, the combination of informative widgets, effective layout organization, and robust API governance will empower your team to respond to performance issues quickly. Remember to document changes, track your metrics, and continuously iterate based on feedback from the dashboard users. In a world where enterprise security using AI is paramount, your Datadog dashboard can be your first line of defense.
APIPark is a high-performance AI gateway that allows you to securely access the most comprehensive LLM APIs globally on the APIPark platform, including OpenAI, Anthropic, Mistral, Llama2, Google Gemini, and more.Try APIPark now! 👇👇👇
Incorporating these strategies will allow you to leave no stone unturned in the quest to enhance performance monitoring across your organization. By leveraging modern technologies and focusing on critical metrics, your Datadog dashboard will be an invaluable tool in navigating the complexities of performance management and API governance.
🚀You can securely and efficiently call the Wenxin Yiyan API on APIPark in just two steps:
Step 1: Deploy the APIPark AI gateway in 5 minutes.
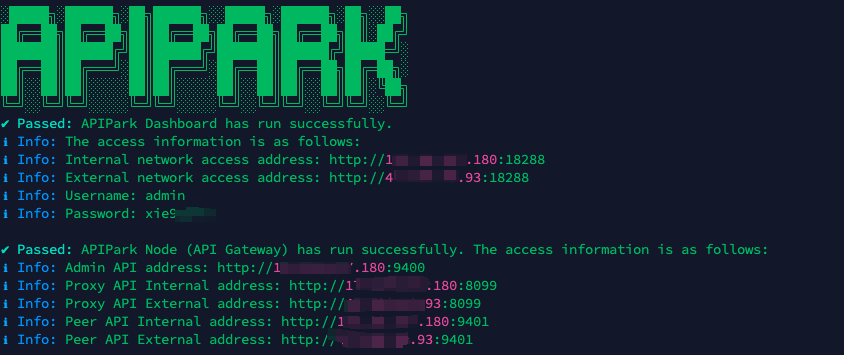
APIPark is developed based on Golang, offering strong product performance and low development and maintenance costs. You can deploy APIPark with a single command line.
curl -sSO https://download.apipark.com/install/quick-start.sh; bash quick-start.sh

In my experience, you can see the successful deployment interface within 5 to 10 minutes. Then, you can log in to APIPark using your account.

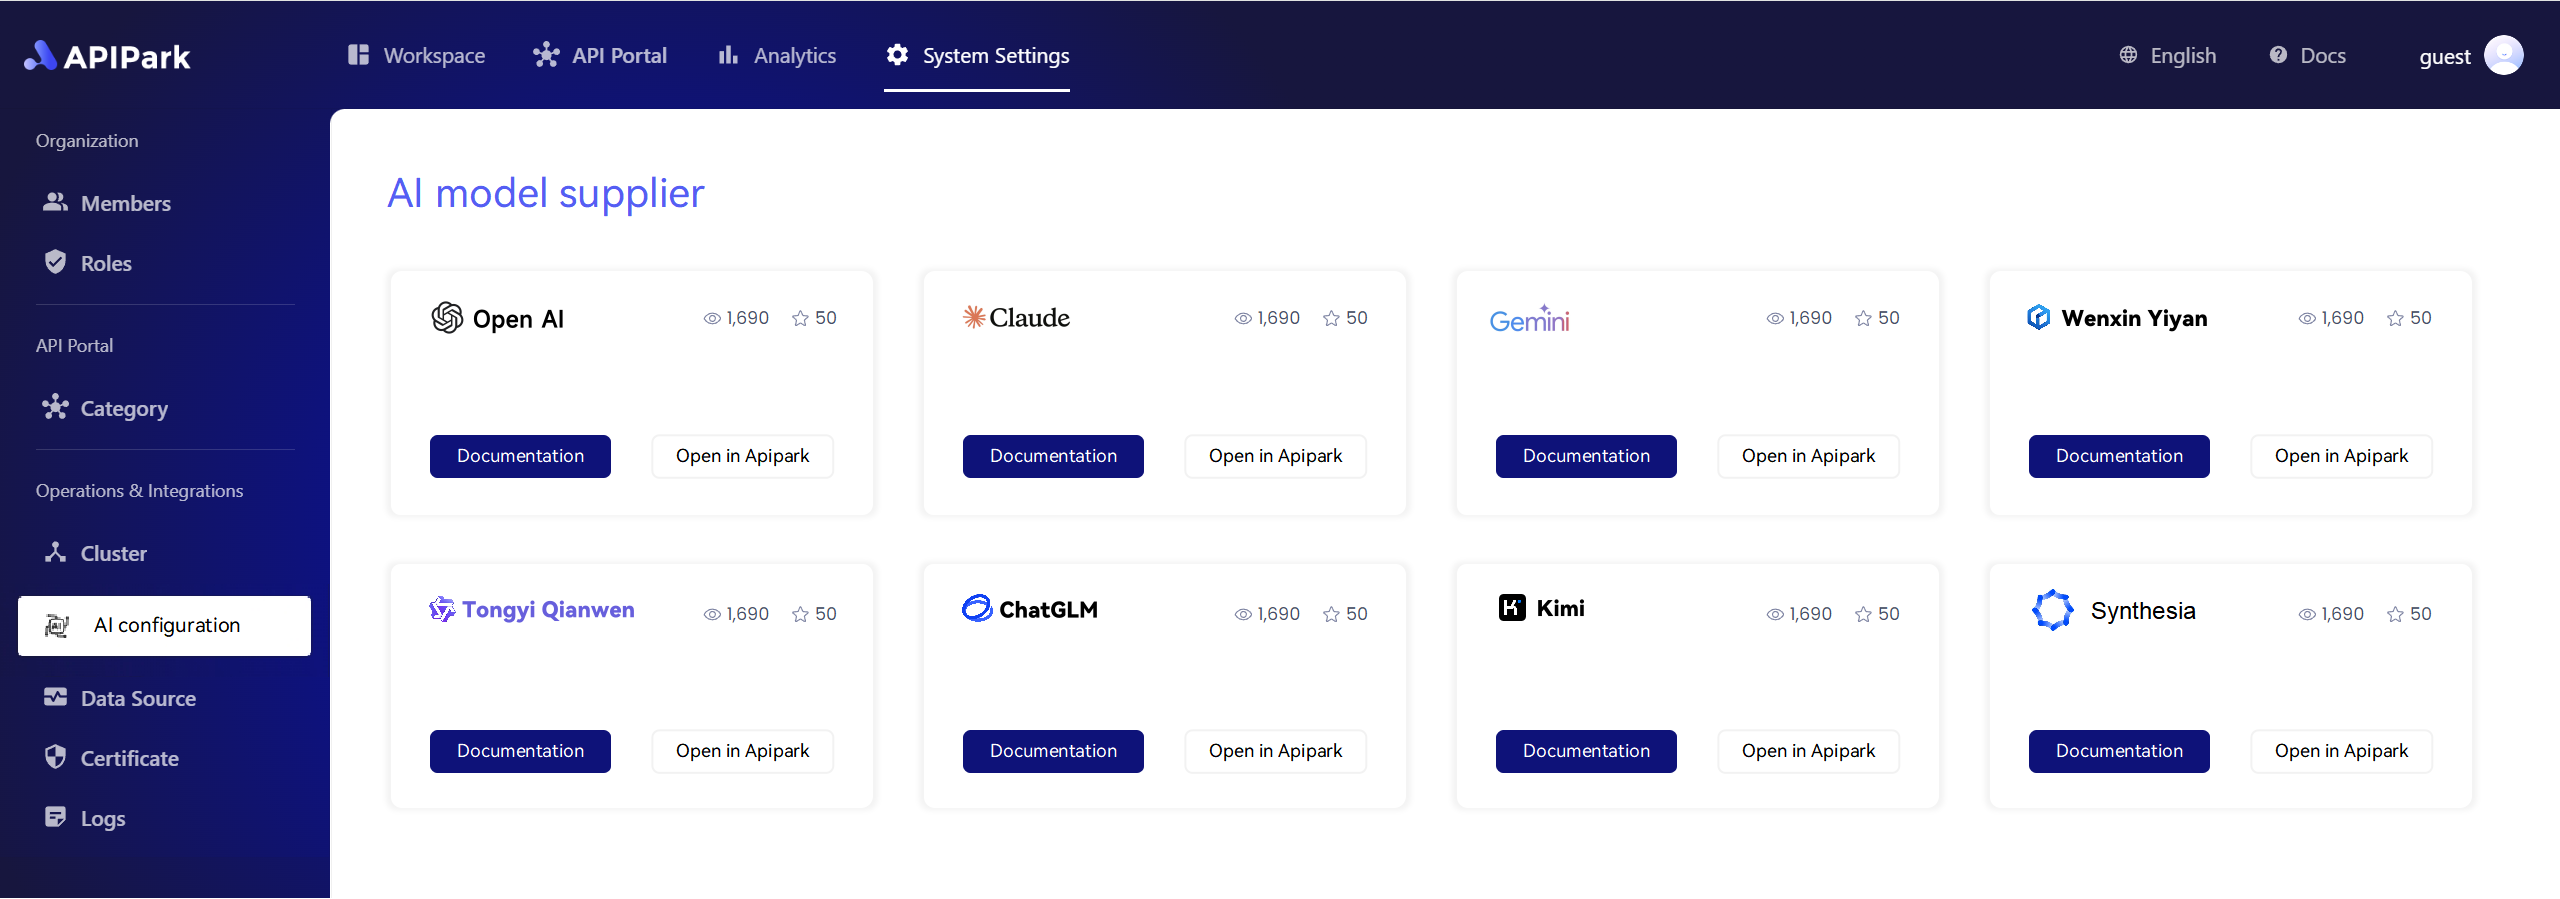
Step 2: Call the Wenxin Yiyan API.
