Datadog has become an essential tool for developers and operations teams to monitor applications and infrastructure performance. Creating an effective dashboard in Datadog ensures that teams can quickly visualize data, identify trends, and address issues proactively. In this article, we will delve into how to create a Datadog dashboard tailored for your monitoring needs while integrating with various tools including AI Gateway, Amazon services, API Developer Portal, and OAuth 2.0 protocols.
Understanding the Importance of Monitoring
Before building a dashboard, it’s crucial to understand why monitoring is essential. Effective monitoring allows teams to:
- Detect Issues Early: Monitoring helps in identifying bottlenecks and potential failures before they impact users.
- Improve Performance: With visuals representing performance metrics, teams can optimize applications.
- Ensure Reliability: Regular monitoring provides insights that are vital for ensuring service reliability and availability.
- Facilitate Compliance: Monitoring can help in maintaining compliance with industry standards and regulations.
Getting Started with Datadog
Signing Up for Datadog
To get started, you need to create an account on Datadog’s official website. Once your account is set up, you can begin integrating your services.
Integrating Services
For a holistic monitoring approach, integrate Datadog with services such as AWS (Amazon Web Services) and API Gateway for AI applications. The integration enables the monitoring of multiple components in one place, making the dashboard more informative.
Connecting AI Gateway
Integrating your AI Gateway with Datadog allows you to monitor AI-driven applications easily. Setup typically involves:
- Creating a Datadog API Key: Navigate to Integrations > APIs in your Datadog account and create an API key.
- Configuring the AI Gateway: Integrate the API key within your AI Gateway settings to ensure data flows to Datadog.
- Setting Up Metrics: Define which metrics from your AI services you wish to track, such as request counts or latency times.
API Developer Portal and OAuth 2.0
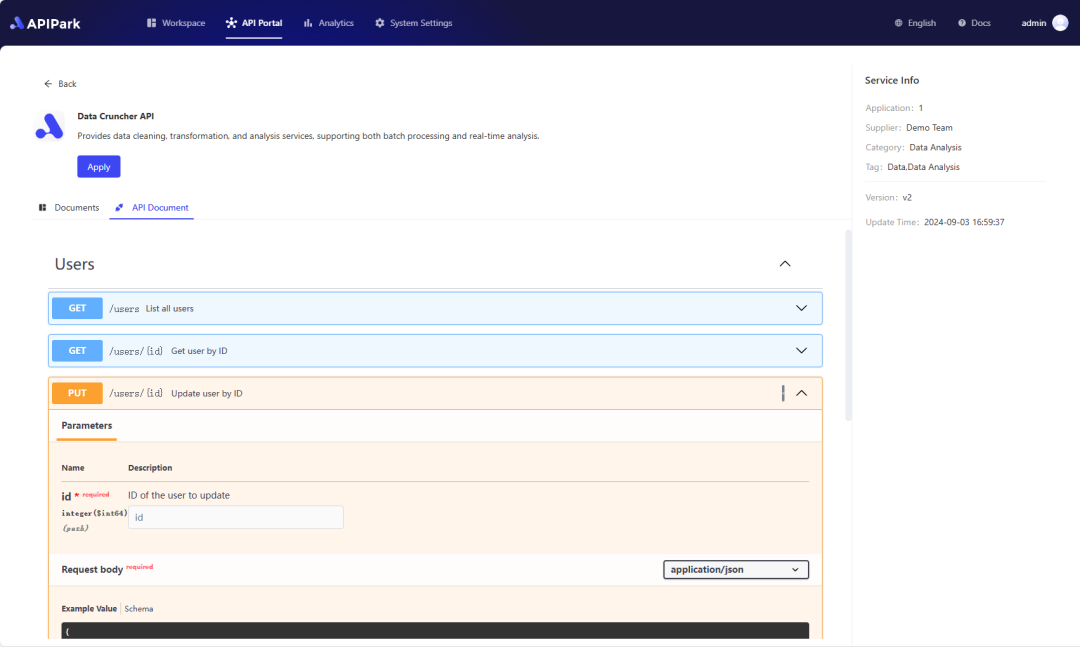
To enhance security and user management, it’s recommended to employ the API Developer Portal combined with OAuth 2.0 for authorization. This ensures that only authenticated users can interact with the APIs that feed data into your Datadog dashboard.
- OAuth Setup: Use OAuth 2.0 to authenticate users accessing your APIs. Configure the portal to manage tokens effectively.
- Integration with Datadog: Each API call can send information to Datadog, helping teams monitor access patterns and detect anomalies.
Creating Your Datadog Dashboard
With your services integrated, it’s time to create an effective dashboard.
Step-by-Step Dashboard Creation
- Access the Dashboard Feature: In your Datadog account, go to Dashboards in the main navbar.
- Create a New Dashboard: Click on the “+ New Dashboard” button.
- Name Your Dashboard: Provide a descriptive name to reflect its purpose (e.g., “AI Gateway Monitoring”).
- Choose a Layout: Select between Timeboard for performance over time or Screenboard for a custom layout.
Adding Widgets
Widgets are the heart of your dashboard, serving as data visualizers. Choose and customize widgets according to the metrics you want to track.
| Widget Type | Use Case |
|---|---|
| Timeseries | Track performance metrics over time. |
| Query Value | Display total request counts in real-time. |
| Top List | Highlight services or APIs with the highest latencies. |
| Heatmap | Visualize the patterns of requests over time. |
Customizing Widgets
As you add widgets, customize them to ensure they meet monitoring needs:
– Define Queries: Specify the metrics you want each widget to display (e.g., avg:aws.ec2.cpuutilization to track CPU usage of EC2 instances).
– Set Time Frames: Opt for default timeframes or allow users to select custom ranges.
– Styling Options: Utilize colors and styles to provide immediate visual cues (e.g., red alerts for high latencies).
Organizing Your Dashboard
Once you have added the necessary widgets, ensure that your dashboard is organized logically.
- Group similar metrics together: Keep all AI Gateway-related metrics in one section, while AWS metrics can have their own grouping.
- Maintain balance: Ensure that the dashboard isn’t overcrowded. Effective dashboards focus on the most impactful metrics.
Monitoring and Iterating
Regularly Review Dashboard
After creating your dashboard, it’s essential to review it regularly:
– Assess if the metrics are still relevant.
– Check whether the widgets are providing clear insights.
– Make adjustments based on any changes in infrastructure or application design.
Share with Your Team
Sharing your dashboard with your team enhances collaboration. Datadog allows you to share viewing rights; you can export your dashboard or invite team members to view it directly within their Datadog accounts.
Example of API Call to Retrieve Data
Here’s a simple example of how you can retrieve API performance data from your connected service:
curl --location 'https://api.datadoghq.com/api/v1/query' \
--header 'Content-Type: application/json' \
--header 'Authorization: Bearer YOUR_API_KEY' \
--data '{
    "query": "avg:your.metric.name{*} by {service}",
    "from": 1620000000,
    "to": 1620020000
}'
Replace YOUR_API_KEY and your.metric.name with your actual API key and the metric you wish to query, respectively.
Conclusion
Creating an effective Datadog dashboard requires careful consideration of what metrics are important for your monitoring needs. By integrating services like the AI Gateway, utilizing the API Developer Portal with OAuth 2.0, and regularly updating your dashboard based on feedback, you can ensure that your monitoring setup is both dynamic and effective.
Incorporating these strategies will not only improve visibility across your applications but will also enhance your team’s ability to respond to incidents and optimize performance.
Let’s embark on this journey of effective monitoring with Datadog to leverage the power of data and insights in making informed decisions.
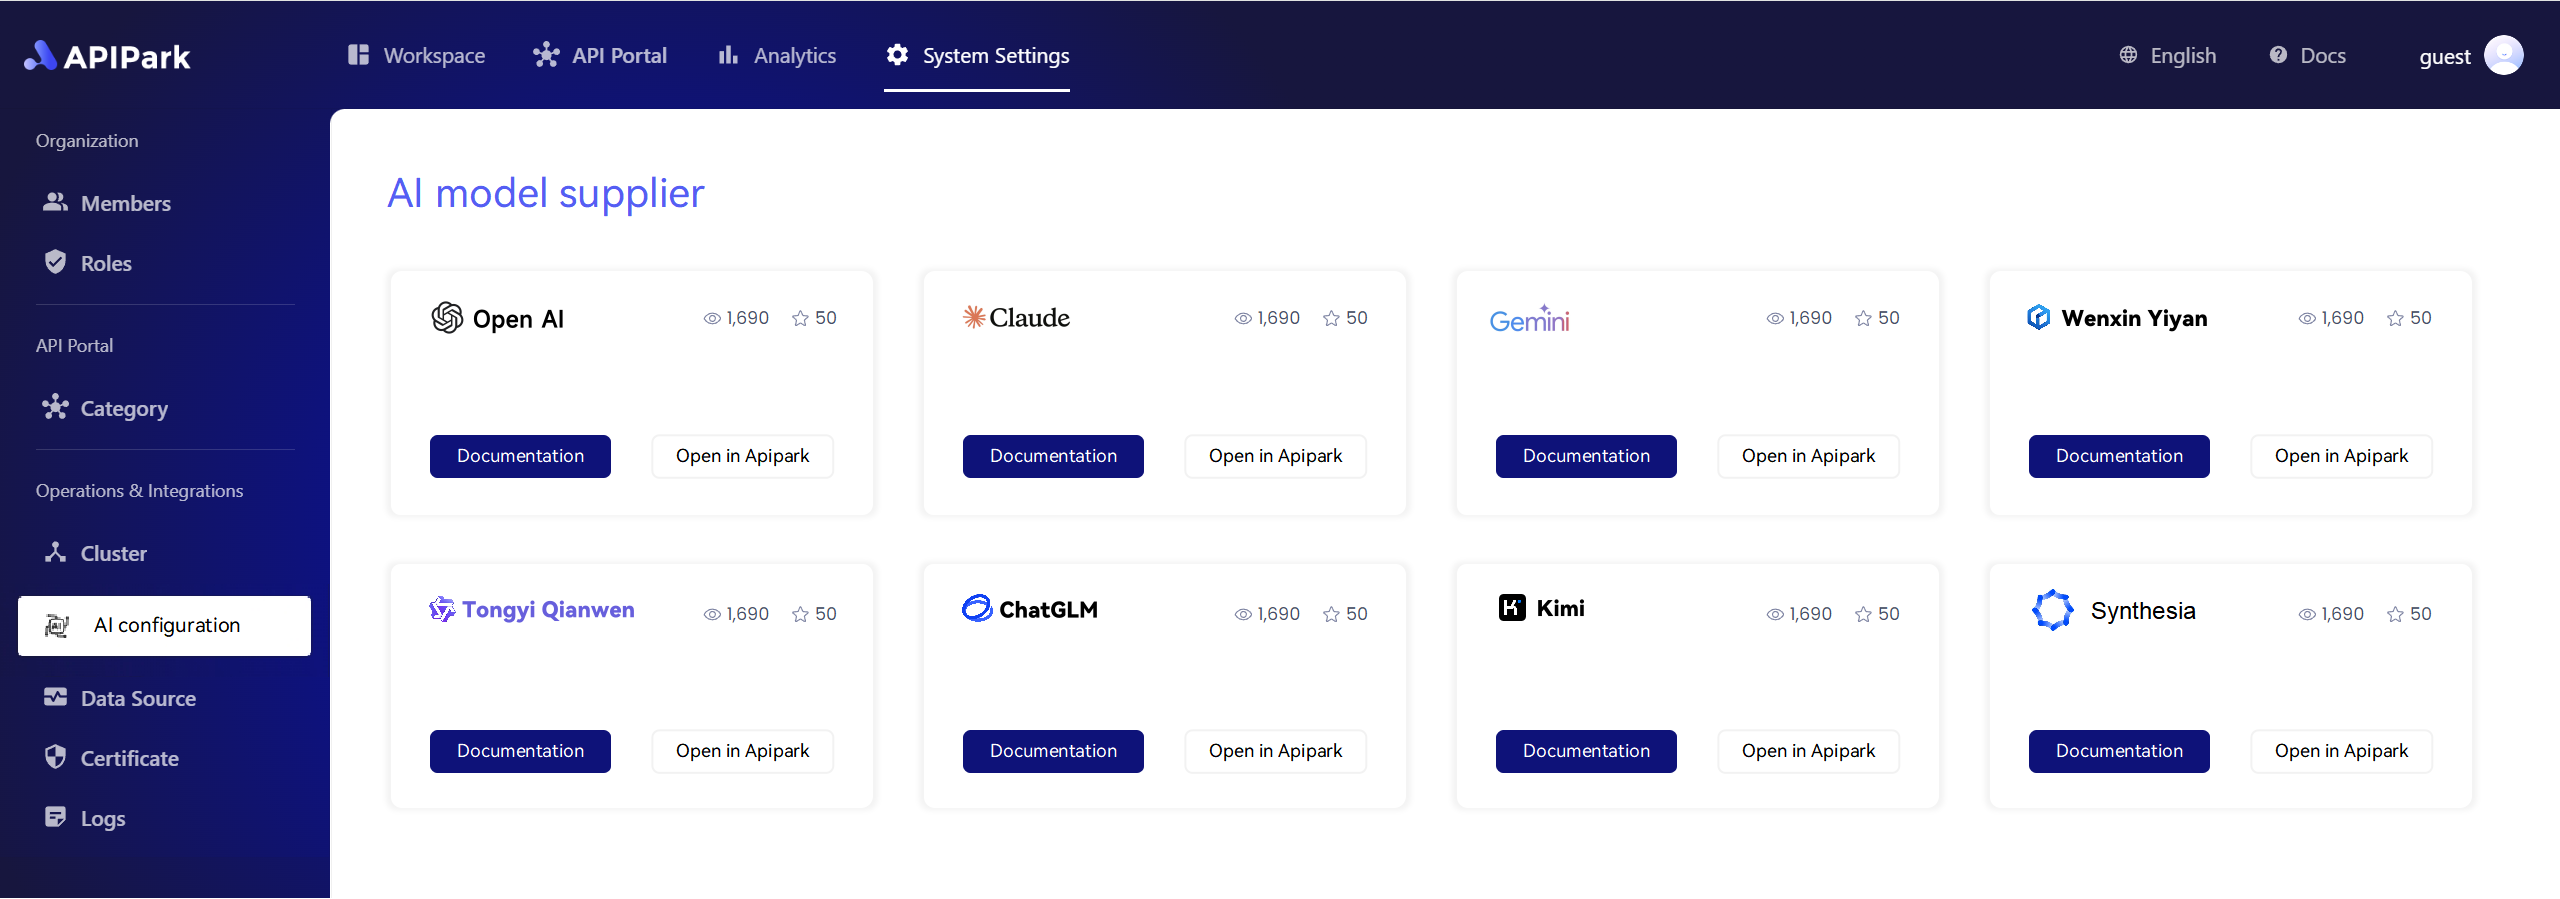
APIPark is a high-performance AI gateway that allows you to securely access the most comprehensive LLM APIs globally on the APIPark platform, including OpenAI, Anthropic, Mistral, Llama2, Google Gemini, and more.Try APIPark now! 👇👇👇
🚀You can securely and efficiently call the 文心一言 API on APIPark in just two steps:
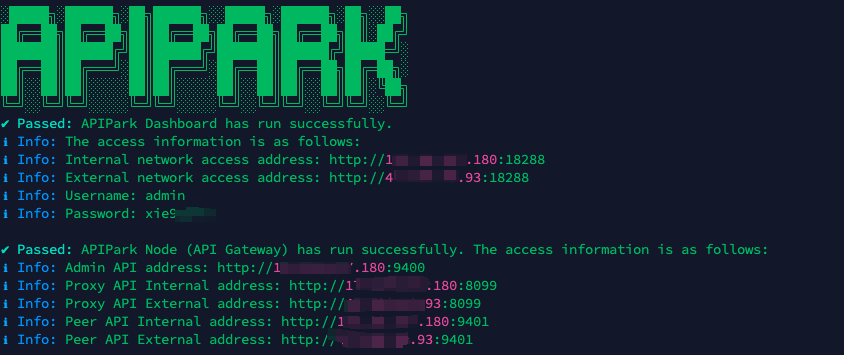
Step 1: Deploy the APIPark AI gateway in 5 minutes.
APIPark is developed based on Golang, offering strong product performance and low development and maintenance costs. You can deploy APIPark with a single command line.
curl -sSO https://download.apipark.com/install/quick-start.sh; bash quick-start.sh

In my experience, you can see the successful deployment interface within 5 to 10 minutes. Then, you can log in to APIPark using your account.

Step 2: Call the 文心一言 API.
